Users may refer to this section as a format for testing SAW process, of the files show in this chapter as the reference in testing SAW pipelines. This chapter includes the statistics results and examples of critical files for each key step.
SN:SS200000135TL_D1
"…" in the demo stands for some lines of log information that can be omitted.
1. mapping
1.1 Statistical Report for CID Mapping and Filtering
$ cat /path/to/output/01.mapping/E100026571_L01_trim_read_1_barcodeMap.stat
    ...
    getBarcodePositionMap_uniqBarcodeTypes: 645784920
    total_reads:    1002214171
    reads_with_polyA:       131113905       13.08%
    reads_filteredByPolyA:  22008148        2.20%
    mapped_reads:   826344259       82.45%
    reads_with_adapter:     9007116 0.90%
    reads_with_dnb: 42264284        4.22%
    barcode_exactlyOverlap_reads:   682746301       68.12%
    barcode_misOverlap_reads:       143590127       14.33%
    barcode_withN_reads:    7831    0.00%
    reads_with_rRNA:        0       0.00%
    Q10_bases_in_barcode:   99.54%
    Q20_bases_in_barcode:   97.49%
    Q30_bases_in_barcode:   91.74%
    Q10_bases_in_umi:       99.26%
    Q20_bases_in_umi:       96.32%
    Q30_bases_in_umi:       89.45%
    Q10_bases_in_seq:       99.47%
    Q20_bases_in_seq:       97.12%
    Q30_bases_in_seq:       91.08%
    umi_filter_reads:       8265089 0.82%
    umi_with_N_reads:       13025   0.00%
    umi_with_polyA_reads:   12365   0.00%
    umi_with_low_quality_base_reads:        8239699 0.82%
    mapped_dnbs: 75619113
    ...
1.2 Statistical Report for Reference Genome Alignment
$ cat /path/to/output/01.mapping/E100026571_L01_trim_read_1.Log.final.out
    ...

                              Number of input reads |       766807770
                          Average input read length |       95
                                        UNIQUE READS:
                       Uniquely mapped reads number |       643871246
                            Uniquely mapped reads % |       83.97%
                              Average mapped length |       95.21
                           Number of splices: Total |       67595584
                Number of splices: Annotated (sjdb) |       65674308
                           Number of splices: GT/AG |       66407685
                           Number of splices: GC/AG |       457595
                           Number of splices: AT/AC |       41563
                   Number of splices: Non-canonical |       688741
                          Mismatch rate per base, % |       0.50%
                             Deletion rate per base |       0.07%
                            Deletion average length |       3.91
                            Insertion rate per base |       0.03%
                           Insertion average length |       1.25
                                 MULTI-MAPPING READS:
            Number of reads mapped to multiple loci |       87649341
                 % of reads mapped to multiple loci |       11.43%
            Number of reads mapped to too many loci |       5301054
                 % of reads mapped to too many loci |       0.69%
                                      UNMAPPED READS:
      Number of reads unmapped: too many mismatches |       0
           % of reads unmapped: too many mismatches |       0.00%
                Number of reads unmapped: too short |       28773993
                     % of reads unmapped: too short |       3.75%
                    Number of reads unmapped: other |       1212136
                         % of reads unmapped: other |       0.16%
                                      CHIMERIC READS:
                           Number of chimeric reads |       0
                                % of chimeric reads |       0.00%
1.3 Example of mapping BAM
$ samtools view /path/to/output/01.mapping/E100026571_L01_trim_read_1.Aligned.sortedByCoord.out.bam | head -2
    E100026571L1C007R00303973559    256     1       3000644 3       100M    *       0       0       GCCTCATTGTGCCCCATATGTTTGCCTATGTTGTGGACTTATTTTCATTAAACTTTAAAACATCTTTAATTTTTTTCTTTATTTCATCATTGACCAAGCT    -FCA9D?GFFD<-D<cgfegd-dg*fgfdfbe;e(9bgge38fffg9gg;0?ggfgb?e@g:ggg3gf79f0ggdg?g
2. merge
2.1 Example of Mapped CID List with Reads Count File
$ head /path/to/output/02.merge/SS200000135TL_D1.merge.barcodeReadsCount.txt
    7127    18002   48
    4348    19028   1
    14130   8635    1
    7618    14537   24
    4912    10945   5
    16783   12914   1
    15539   8177    1
    9288    8082    14
    7274    16533   59
    9087    10657   10
3. count
3.1 Statistical Report for MID Filtering and Gene Annotation
$ cat /path/to/output/03.count/SS200000135TL_D1.Aligned.sortedByCoord.out.merge.q10.dedup.target.bam.summary.stat
    ## FILTER & DEDUPLICATION METRICS
    TOTAL_READS     PASS_FILTER     ANNOTATED_READS UNIQUE_READS    FAIL_FILTER_RATE        FAIL_ANNOTATE_RATE      DUPLICATION_RATE
    731520587       643871246       532386027       108123310       11.98   17.31   79.69
    ## ANNOTATION METRICS
    TOTAL_READS     MAP     EXONIC  INTRONIC        INTERGENIC      TRANSCRIPTOME   ANTISENSE
    643871246       643871246       483163052       49222975        111485219       532386027       109940618
    100.0   100.0   75.0    7.6     17.3    82.7    17.1
3.2 Example of Annotated BAM
$ samtools view /path/to/output/03.count/SS200000135TL_D1.Aligned.sortedByCoord.out.merge.q10.dedup.target.bam | head -2
    E100026571L1C003R03702347721    0       1       3001778 255     100M    *       0       0       GTATGACATCTGTCCAGGATCTTCTAGCTTTCATAGTCTCTGGTGAGAAGTCTGGAGTAATTCTAATAGGCCTGCATTTATATGTTACTTGACCTTTTTC    EEFEDFFEFFFFEFFFFEC@EFFFFDFFEEFFEFFFFCFCEFFAFBFCED??FGBEFFDC:FFFDCFAF4FAFFDFFDG?DFBD.F@FECA/FEDEFFAA    NH:i:1  HI:i:1  AS:i:92 nM:i:3  Cx:i:12136      Cy:i:14034      UR:Z:C0808      XF:i:2
    E100026571L1C005R02302788444    528     1       3016331 0       100M    *       0       0       TTTATGTGGAGTTCCTTAATCCACTTAGATTTGACCTTAGTACAAGGAGATAGGAATGGATCAATTCGCATTCTTCTACATGATAACAGCCAGTTGTACC    ;FDF>FCFFEAD:FFEBF=@FFDEEFFFC@EFCEFDDFFCE?FDFF7EEECFDEFFFCEFCCEEDEEEFEFBFEEFFDEEFFFEEDFFEDFEEEEFFEED    NH:i:5  HI:i:1  AS:i:96 nM:i:1  Cx:i:6628       Cy:i:7872       UR:Z:EDFF9
3.3 Example of count Gene Expression Matrix
$ h5dump -n /path/to/output/03.count/SS200000135TL_D1.raw.gef
    HDF5 "/path/to/output/03.count/SS200000135TL_D1.raw.gef" {
    FILE_CONTENTS {
     group      /
     group      /geneExp
     group      /geneExp/bin1
     dataset    /geneExp/bin1/exon
     dataset    /geneExp/bin1/expression
     dataset    /geneExp/bin1/gene
     }
    }

    $ h5dump -d /geneExp/bin1/expression  /path/to/output/03.count/SS200000135TL_D1.raw.gef | head -15
    HDF5 "/path/to/output/03.count/SS200000135TL_D1.raw.gef" {
    DATASET "/geneExp/bin1/expression" {
       DATATYPE  H5T_COMPOUND {
          H5T_STD_U32LE "x";
          H5T_STD_U32LE "y";
          H5T_STD_U8LE "count";
       }
       DATASPACE  SIMPLE { ( 76041339 ) / ( 76041339 ) }
       DATA {
       (0): {
             4888,
             10392,
             1
          },
       (1): {

    $ h5dump -d /geneExp/bin1/gene /path/to/output/03.count/SS200000135TL_D1.raw.gef | head -20
    HDF5 "/path/to/output/03.count/SS200000135TL_D1.raw.gef" {
    DATASET "/geneExp/bin1/gene" {
       DATATYPE  H5T_COMPOUND {
          H5T_STRING {
             STRSIZE 32;
             STRPAD H5T_STR_NULLTERM;
             CSET H5T_CSET_ASCII;
             CTYPE H5T_C_S1;
          } "gene";
          H5T_STD_U32LE "offset";
          H5T_STD_U32LE "count";
       }
       DATASPACE  SIMPLE { ( 24661 ) / ( 24661 ) }
       DATA {
       (0): {
             "Gm1992",
             0,
             132
          },
       (1): {
3.4 Example of count Sampling File
$ head -8 /path/to/output/03.count/SS200000135TL_D1_raw_barcode_gene_exp.txt
    y x geneIndex MIDIndex readCount
    10392 4888 10551 665954 4
    7096 8901 10551 881671 1
    7096 8901 10551 357383 20
    18783 7397 10551 355789 1
    13032 9155 10551 297666 1
    13032 9155 10551 298690 1
    11778 10617 10551 686313 4
4. register and imageTools
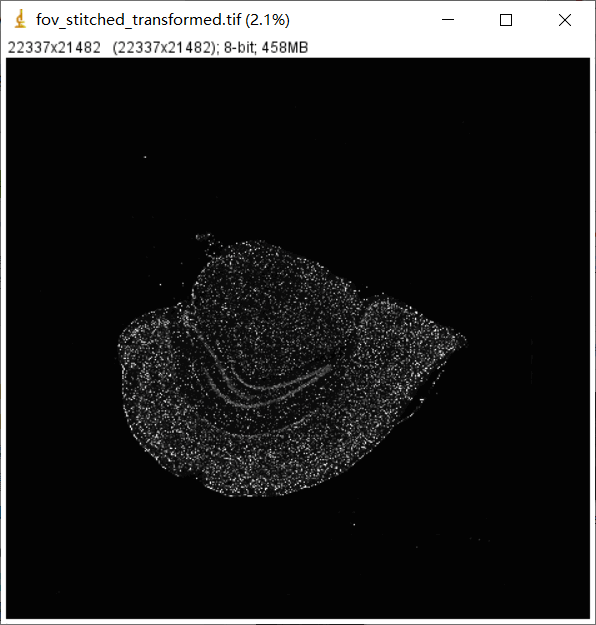
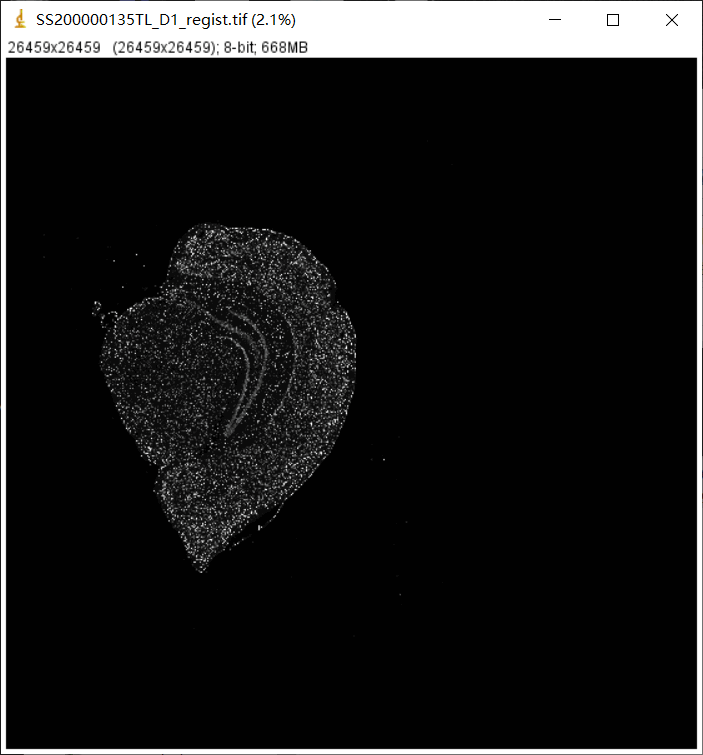
4.1 Registered Image
File /path/to/output/04.register/ssDNA_fov_stitched_transformed.tif and /path/to/output/04.register/ssDNA_SS200000135TL_D1_regist.tif.
/path/to/output/04.register/ssDNA_fov_stitched_transformed.tif
/path/to/output/04.register/ssDNA_SS200000135TL_D1_regist.tif
4.2 Image Process Record File
h5dump -n /path/to/output/04.register/SS200000135TL_D1_20220527_201353_1.1.0.ipr
    HDF5 "/path/to/output/04.register/SS200000135TL_D1_20220527_201353_1.1.0.ipr" {
    FILE_CONTENTS {
     group      /
     group      /DAPI
     group      /DAPI/CellSeg
     dataset    /DAPI/CellSeg/CellMask
     group      /DAPI/ImageInfo
     dataset    /DAPI/ImageInfo/RGBScale
     dataset    /DAPI/Preview
     group      /DAPI/QCInfo
     group      /DAPI/QCInfo/CrossPoints
     dataset    /DAPI/QCInfo/CrossPoints/0_0
     ...
     dataset    /DAPI/QCInfo/CrossPoints/9_7
     dataset    /DAPI/QCInfo/ScopeStitchQCMatrix
     group      /DAPI/Register
     dataset    /DAPI/Register/MatrixTemplate
     group      /DAPI/Stitch
     group      /DAPI/Stitch/BGIStitch
     dataset    /DAPI/Stitch/BGIStitch/StitchedGlobalLoc
     group      /DAPI/Stitch/ScopeStitch
     dataset    /DAPI/Stitch/ScopeStitch/GlobalLoc
     group      /DAPI/Stitch/StitchEval
     dataset    /DAPI/Stitch/StitchEval/StitchEvalH
     dataset    /DAPI/Stitch/StitchEval/StitchEvalV
     dataset    /DAPI/Stitch/TemplatePoint
     dataset    /DAPI/Stitch/TransformTemplate
     group      /DAPI/TissueSeg
     dataset    /DAPI/TissueSeg/TissueMask
     group      /ManualState
     group      /StereoResepSwitch
     }
    }
    $ h5dump -A /path/to/output/04.register/SS200000135TL_D1_20220527_201353_1.1.0.ipr | head -20
    HDF5 "/path/to/output/04.register/SS200000135TL_D1_20220527_201353_1.1.0.ipr" {
    GROUP "/" {
       ATTRIBUTE "IPRVersion" {
          DATATYPE  H5T_STRING {
             STRSIZE H5T_VARIABLE;
             STRPAD H5T_STR_NULLTERM;
             CSET H5T_CSET_UTF8;
             CTYPE H5T_C_S1;
          }
          DATASPACE  SCALAR
          DATA {
          (0): "0.1.0"
          }
       }
       GROUP "ManualState" {
          ATTRIBUTE "cellseg" {
             DATATYPE  H5T_ENUM {
                H5T_STD_I8LE;
                "FALSE"            0;
                "TRUE"             1;
4.3 ImageTools merge
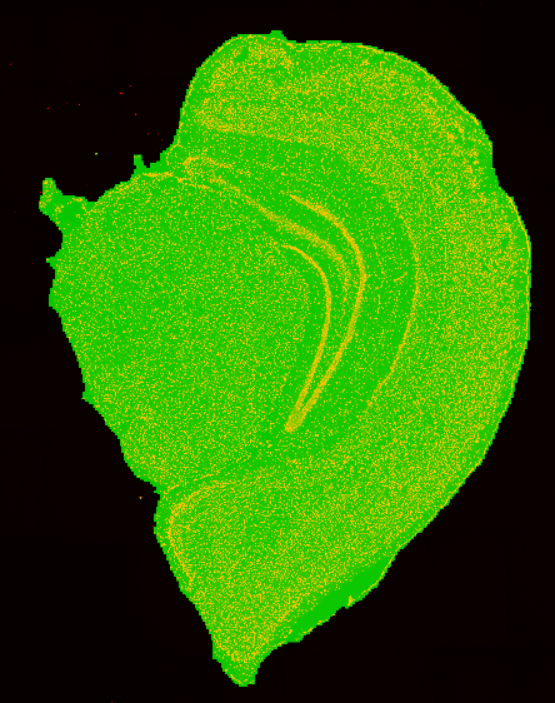
Merged image of microscopy image ssDNA_SS200000135TL_D1_regist.tif and tissue segmentation mask file ssDNA_SS200000135TL_D1_tissue_cut.tif to check tissue segmentation performance.
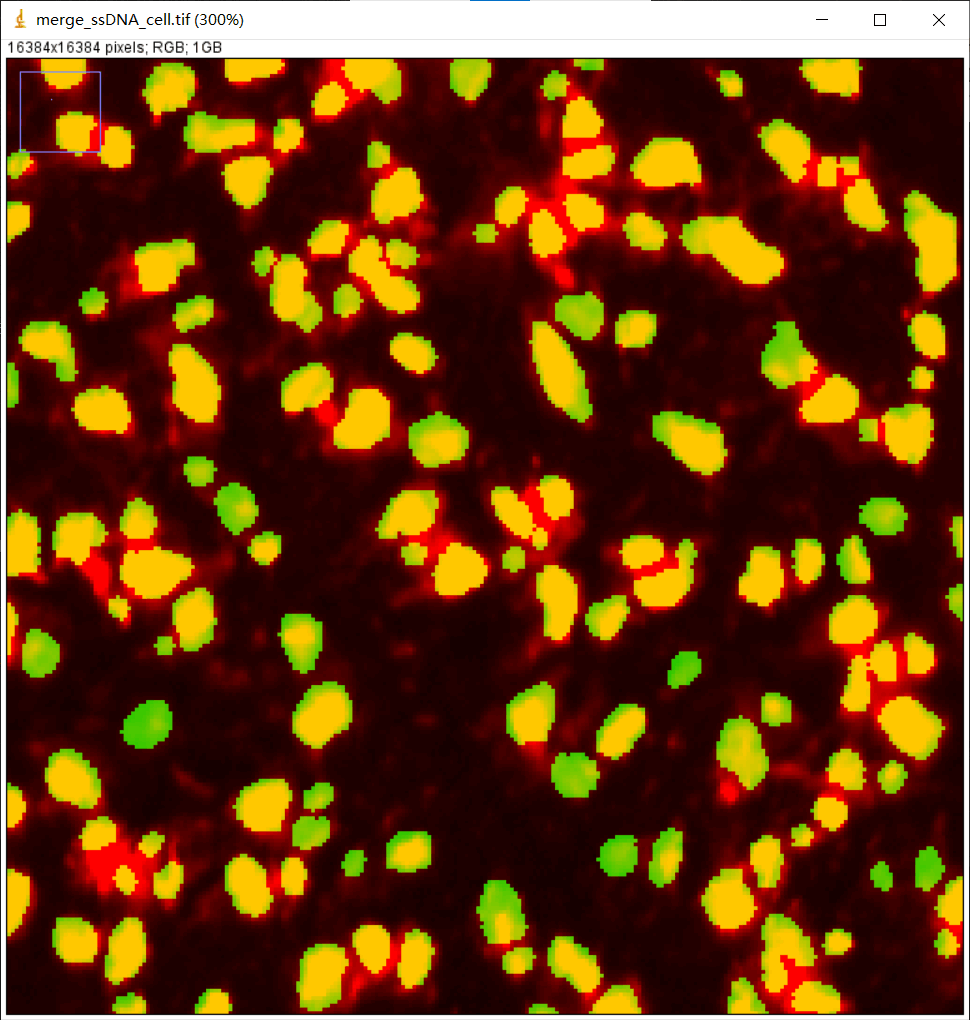
Part of merged image of microscopy image ssDNA_SS200000135TL_D1_regist.tif and cell segmentation mask file ssDNA_SS200000135TL_D1_mask.tif to check cell segmentation performance.
4.4 ImageTools overlay
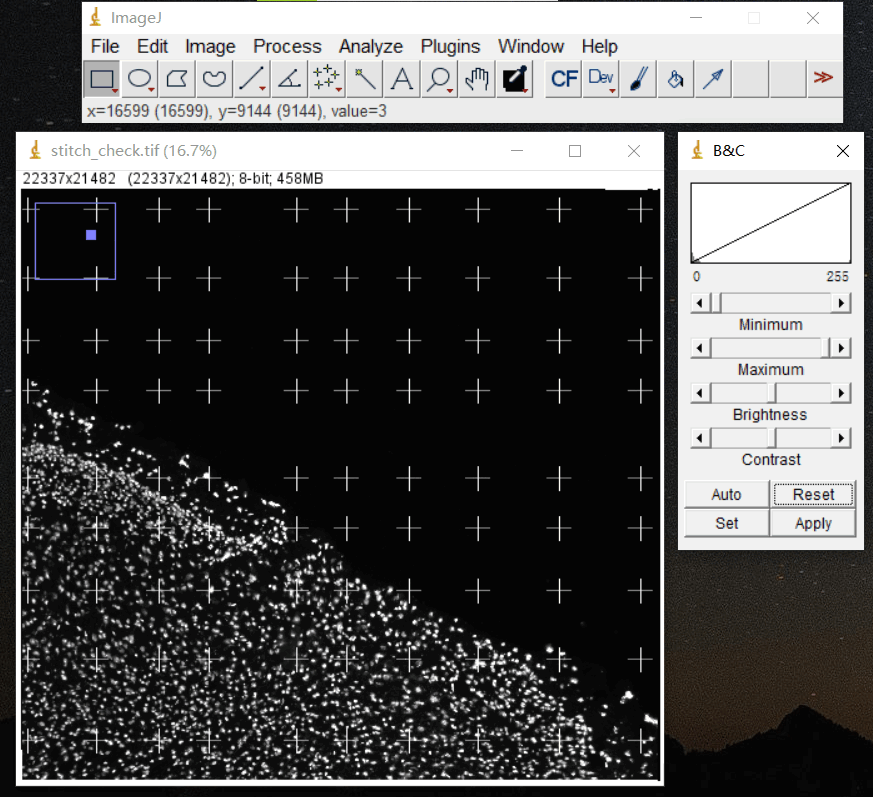
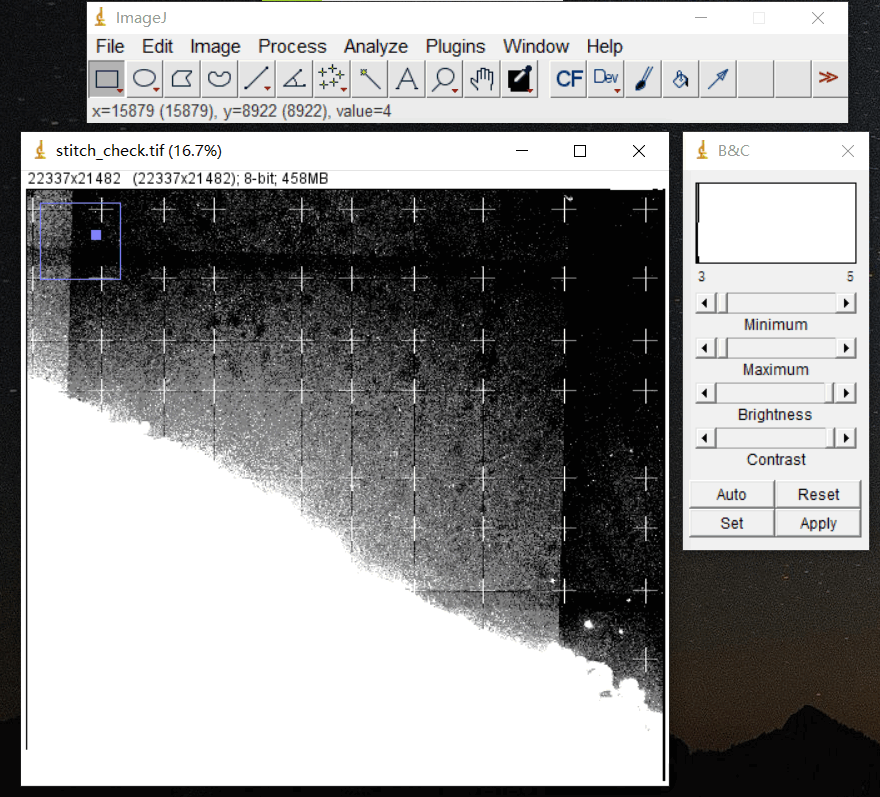
Stack stitching template onto the ssDNA_fov_stitched_transformed.tif to check the result of stitching.
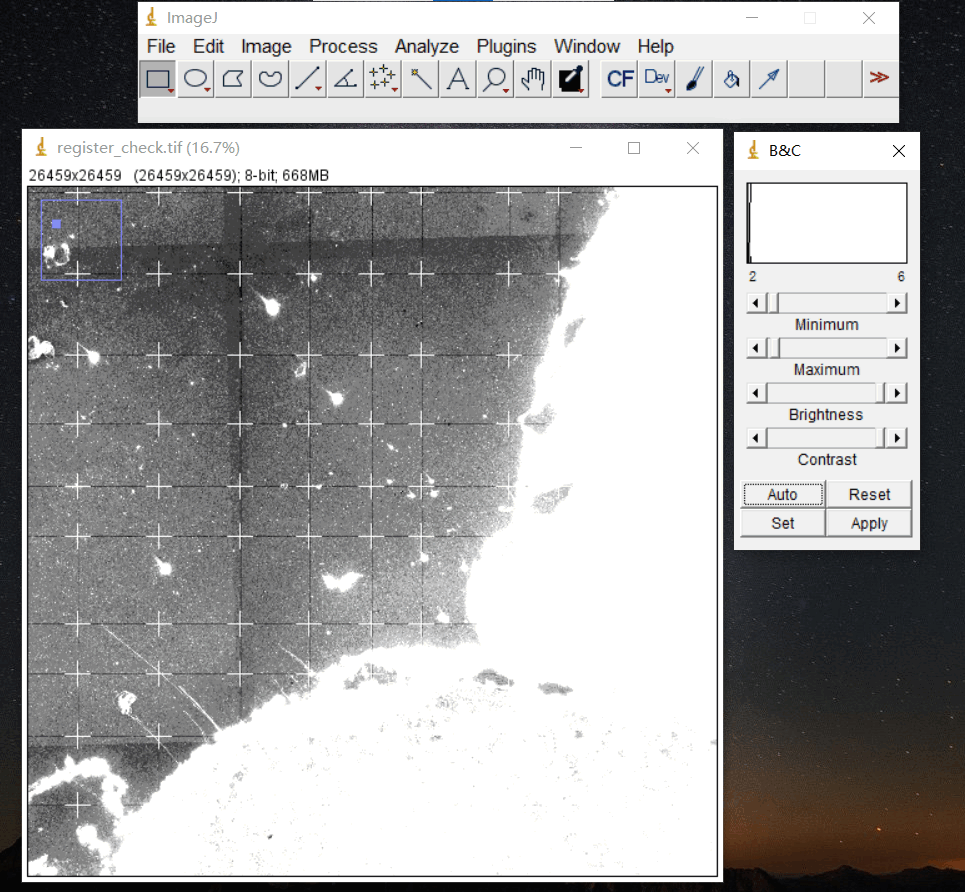
Stack registration template onto the ssDNA_SS200000135TL_D1_regist.tif to check the result of registration.
5. tissueCut
5.1 Statistical Report for Tissue Covered Region
$ cat /path/to/output/05.tissuecut/tissuecut.stat
    # Tissue Statistic Analysis with Stain Image
    Contour_area: 88648172
    Number_of_DNB_under_tissue: 36681107
    Ratio: 41.38%
    Total_gene_type: 24300
    MID_counts: 89818303
    Fraction_MID_in_spots_under_tissue: 83.07%
    Reads_under_tissue: 648385443
    Fraction_reads_in_spots_under_tissue: 78.46%

    binSize=1
    Mean_reads_per_spot: 17.68
    Median_reads_per_spot: 11.00
    Mean_gene_type_per_spot: 1.71
    Median_gene_type_per_spot: 1
    Mean_Umi_per_spot: 2.45
    Median_Umi_per_spot: 2

    binSize=20
    Mean_reads_per_spot: 2911.89
    Median_reads_per_spot: 2445.00
    Mean_gene_type_per_spot: 237.55
    Median_gene_type_per_spot: 223
    Mean_Umi_per_spot: 403.37
    Median_Umi_per_spot: 364

    binSize=50
    Mean_reads_per_spot: 18042.28
    Median_reads_per_spot: 16195.00
    Mean_gene_type_per_spot: 1151.00
    Median_gene_type_per_spot: 1117
    Mean_Umi_per_spot: 2499.33
    Median_Umi_per_spot: 2308

    binSize=100
    Mean_reads_per_spot: 71102.70
    Median_reads_per_spot: 64449.00
    Mean_gene_type_per_spot: 3082.76
    Median_gene_type_per_spot: 3080
    Mean_Umi_per_spot: 9849.58
    Median_Umi_per_spot: 9066

    binSize=150
    Mean_reads_per_spot: 157566.33
    Median_reads_per_spot: 143745.00
    Mean_gene_type_per_spot: 4890.24
    Median_gene_type_per_spot: 5026
    Mean_Umi_per_spot: 21827.05
    Median_Umi_per_spot: 20205

    binSize=200
    Mean_reads_per_spot: 276733.00
    Median_reads_per_spot: 254272.00
    Mean_gene_type_per_spot: 6403.57
    Median_gene_type_per_spot: 6719
    Mean_Umi_per_spot: 38334.74
    Median_Umi_per_spot: 35679
5.2 Example of Gene Expression Matrix for Tissue Covered Region
$ h5dump -n /path/to/output/05.tissuecut/SS200000135TL_D1.tissue.gef
    HDF5 "/path/to/output/05.tissuecut/SS200000135TL_D1.tissue.gef" {
    FILE_CONTENTS {
     group      /
     group      /geneExp
     group      /geneExp/bin1
     dataset    /geneExp/bin1/exon
     dataset    /geneExp/bin1/expression
     dataset    /geneExp/bin1/gene
     }

    $ h5dump -d /geneExp/bin1/expression /path/to/output/05.tissuecut/SS200000135TL_D1.tissue.gef | head -15
    HDF5 "/path/to/output/05.tissuecut/SS200000135TL_D1.tissue.gef" {
    DATASET "/geneExp/bin1/expression" {
       DATATYPE  H5T_COMPOUND {
          H5T_STD_U32LE "x";
          H5T_STD_U32LE "y";
          H5T_STD_U8LE "count";
       }
       DATASPACE  SIMPLE { ( 62649229 ) / ( 62649229 ) }
       DATA {
       (0): {
             9915,
             15992,
             1
          },
       (1): {

    h5dump -d /geneExp/bin1/gene /path/to/output/05.tissuecut/SS200000135TL_D1.tissue.gef | head -20
    HDF5 "/path/to/output/05.tissuecut/SS200000135TL_D1.tissue.gef" {
    DATASET "/geneExp/bin1/gene" {
       DATATYPE  H5T_COMPOUND {
          H5T_STRING {
             STRSIZE 32;
             STRPAD H5T_STR_NULLPAD;
             CSET H5T_CSET_ASCII;
             CTYPE H5T_C_S1;
          } "gene";
          H5T_STD_U32LE "offset";
          H5T_STD_U32LE "count";
       }
       DATASPACE  SIMPLE { ( 24300 ) / ( 24300 ) }
       DATA {
       (0): {
             "Gm37381",
             0,
             3
          },
       (1): {
5.3 Example of Gene Expression Matrix for a complete GEF
$ h5dump -n /path/to/output/05.tissuecut/SS200000135TL_D1.gef
    HDF5 "/path/to/output/05.tissuecut/SS200000135TL_D1.gef" {
    FILE_CONTENTS {
     group      /
     group      /geneExp
     group      /geneExp/bin1
     dataset    /geneExp/bin1/exon
     dataset    /geneExp/bin1/expression
     dataset    /geneExp/bin1/gene
     group      /geneExp/bin10
     dataset    /geneExp/bin10/exon
     dataset    /geneExp/bin10/expression
     dataset    /geneExp/bin10/gene
     group      /geneExp/bin100
     dataset    /geneExp/bin100/exon
     dataset    /geneExp/bin100/expression
     dataset    /geneExp/bin100/gene
     group      /geneExp/bin20
     dataset    /geneExp/bin20/exon
     dataset    /geneExp/bin20/expression
     dataset    /geneExp/bin20/gene
     group      /geneExp/bin200
     dataset    /geneExp/bin200/exon
     dataset    /geneExp/bin200/expression
     dataset    /geneExp/bin200/gene
     group      /geneExp/bin50
     dataset    /geneExp/bin50/exon
     dataset    /geneExp/bin50/expression
     dataset    /geneExp/bin50/gene
     group      /geneExp/bin500
     dataset    /geneExp/bin500/exon
     dataset    /geneExp/bin500/expression
     dataset    /geneExp/bin500/gene
     group      /stat
     dataset    /stat/gene
     group      /wholeExp
     dataset    /wholeExp/bin1
     dataset    /wholeExp/bin10
     dataset    /wholeExp/bin100
     dataset    /wholeExp/bin20
     dataset    /wholeExp/bin200
     dataset    /wholeExp/bin50
     dataset    /wholeExp/bin500
     group      /wholeExpExon
     dataset    /wholeExpExon/bin1
     dataset    /wholeExpExon/bin10
     dataset    /wholeExpExon/bin100
     dataset    /wholeExpExon/bin20
     dataset    /wholeExpExon/bin200
     dataset    /wholeExpExon/bin50
     dataset    /wholeExpExon/bin500
     }
    }

    $ h5dump -d /stat/gene /path/to/output/05.tissuecut/SS200000135TL_D1.gef | head -20
    HDF5 "/path/to/output/05.tissuecut/SS200000135TL_D1.gef" {
    DATASET "/stat/gene" {
       DATATYPE  H5T_COMPOUND {
          H5T_STRING {
             STRSIZE 32;
             STRPAD H5T_STR_NULLTERM;
             CSET H5T_CSET_ASCII;
             CTYPE H5T_C_S1;
          } "gene";
          H5T_STD_U32LE "MIDcount";
          H5T_IEEE_F32LE "E10";
       }
       DATASPACE  SIMPLE { ( 24661 ) / ( 24661 ) }
       DATA {
       (0): {
             "Gm42418",
             5861037,
             60.1033
          },
       (1): {
6. cellCut
6.1 Example of Gene Expression Matrix for Cell Bins
$ h5dump -n /path/to/output/051.cellcut/SS200000135TL_D1.cellbin.gef
    HDF5 "/path/to/output/051.cellcut/SS200000135TL_D1.cellbin.gef" {
    FILE_CONTENTS {
     group      /
     group      /cellBin
     dataset    /cellBin/blockIndex
     dataset    /cellBin/blockSize
     dataset    /cellBin/cell
     dataset    /cellBin/cellBorder
     dataset    /cellBin/cellExon
     dataset    /cellBin/cellExp
     dataset    /cellBin/cellExpExon
     dataset    /cellBin/cellTypeList
     dataset    /cellBin/gene
     dataset    /cellBin/geneExon
     dataset    /cellBin/geneExp
     dataset    /cellBin/geneExpExon
     }
    }
7. saturation
$ cat /path/to/output/07.saturation/sequence_saturation.tsv
    sample  bar_x   bar_y1  bar_y2  bar_umi bin_x   bin_y1  bin_y2  bin_umi
    0.05    26619302        0.250959        1       19938952        26619302        0.27571 3270    7613
    0.1     53238604        0.390241        1       32462699        53238604        0.41122 4268    12394
    0.2     106477208       0.543149        1       48644210        106477208       0.558617        5215    18573
    0.3     159715808       0.625887        1       59751787        159715808       0.638094        5693    22814
    0.4     212954416       0.67839 1       68488171        212954416       0.688522        5995    26150
    0.5     266193008       0.714813        1       75914701        266193008       0.723539        6204    28985
    0.6     319431616       0.741736        1       82497808        319431616       0.749427        6378    31499
    0.7     372670208       0.76249 1       88513055        372670208       0.769402        6517    33795
    0.8     425908832       0.779116        1       94076279        425908832       0.78542 6642    35920
    0.9     479147392       0.792733        1       99311385        479147392       0.798541        6747    37918
    1       532386027       0.804159        1       104262941       532386027       0.809561        6840    39472
8. report
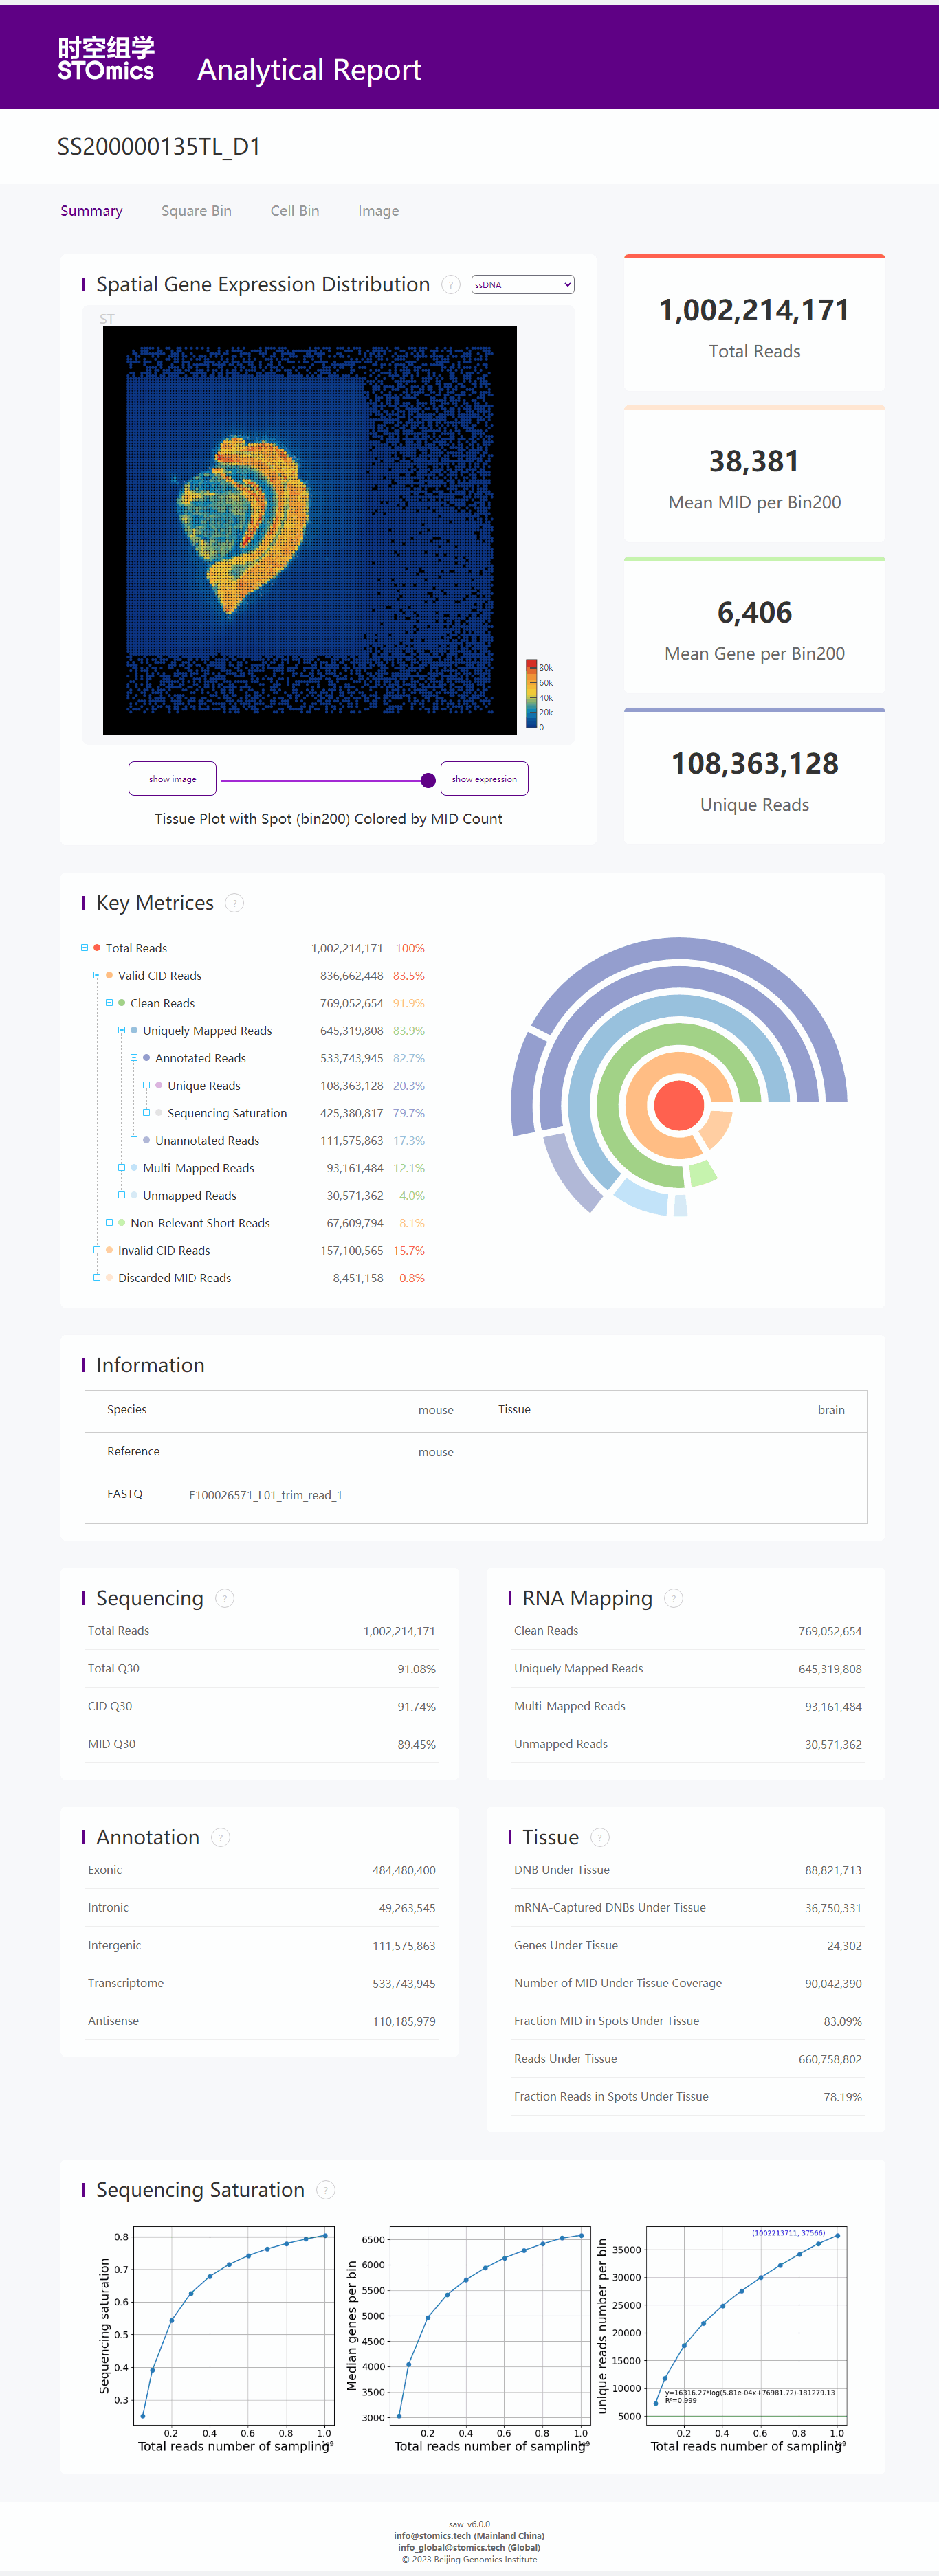
8.1 Example of Statistical Summary Report
cat /path/to/output/08.report/SS200000135TL_D1.statistics.json
    {
        "version": "version_v2",
        "1.Filter_and_Map": {
            "1.1.Adapter_Filter": [
                {
                    "Sample_id": "E100026571_L01_trim_read_1",
                    "getCIDPositionMap_uniqCIDTypes": "645784920",
                    "total_reads": "1002214171",
                    "mapped_reads": "826344259(82.45%)",
                    "CID_misOverlap_reads": "143590127(14.33%)",