All
Products
Resources
News
FAQ
Search
17/07/2025 Zheng Zhong
Cell type annotation for spatial transcriptomics presents distinct computational challenges, particularly for large-scale, high-resolution Stereo-seq data. Although multiple cell type annotation algorithms have been proposed, choosing the optimal algorithm for specific study needs is still complex. In a recent webinar, the STOmics team explored various algorithms for annotating Stereo-seq data. This blog summarizes key concepts from that session, examining different annotation algorithms and their performance. Our goal is to equip you with foundational knowledge and guide your choice of algorithm for annotating your own datasets.
Understanding the spatial organization of cells and their interactions requires determining the cellular identity of each bin/spot within spatial transcriptomics data. Unlike single-cell transcriptomics data, sequencing-based spatial datasets often lack single-cell resolution or exhibit limited gene detection, complicating annotation process. To address this challenge, many algorithms have been developed to map the annotated single-cell reference to spatially resolved spots, therefore decomposing each spot to a combination of cell types. This process, known as deconvolution, is the core mechanism in most cell type annotation algorithms.
To annotate spatial transcriptomics data, the process typically begins by filtering highly informative genes for each annotated cell type within the reference single-cell data, generating a reference cell type expression matrix. This filtering step can be performed by the annotation algorithm or determined independently. Next, we can use mathematical models to integrate the reference cell type gene expression matrix and the spatial data to solve the cell types at each spatial location. The output generally provides cell type proportions for each spot/bin, and we can take the most abundant cell type within a bin to represent it, which is called major cell type identification. (Fig. 1)
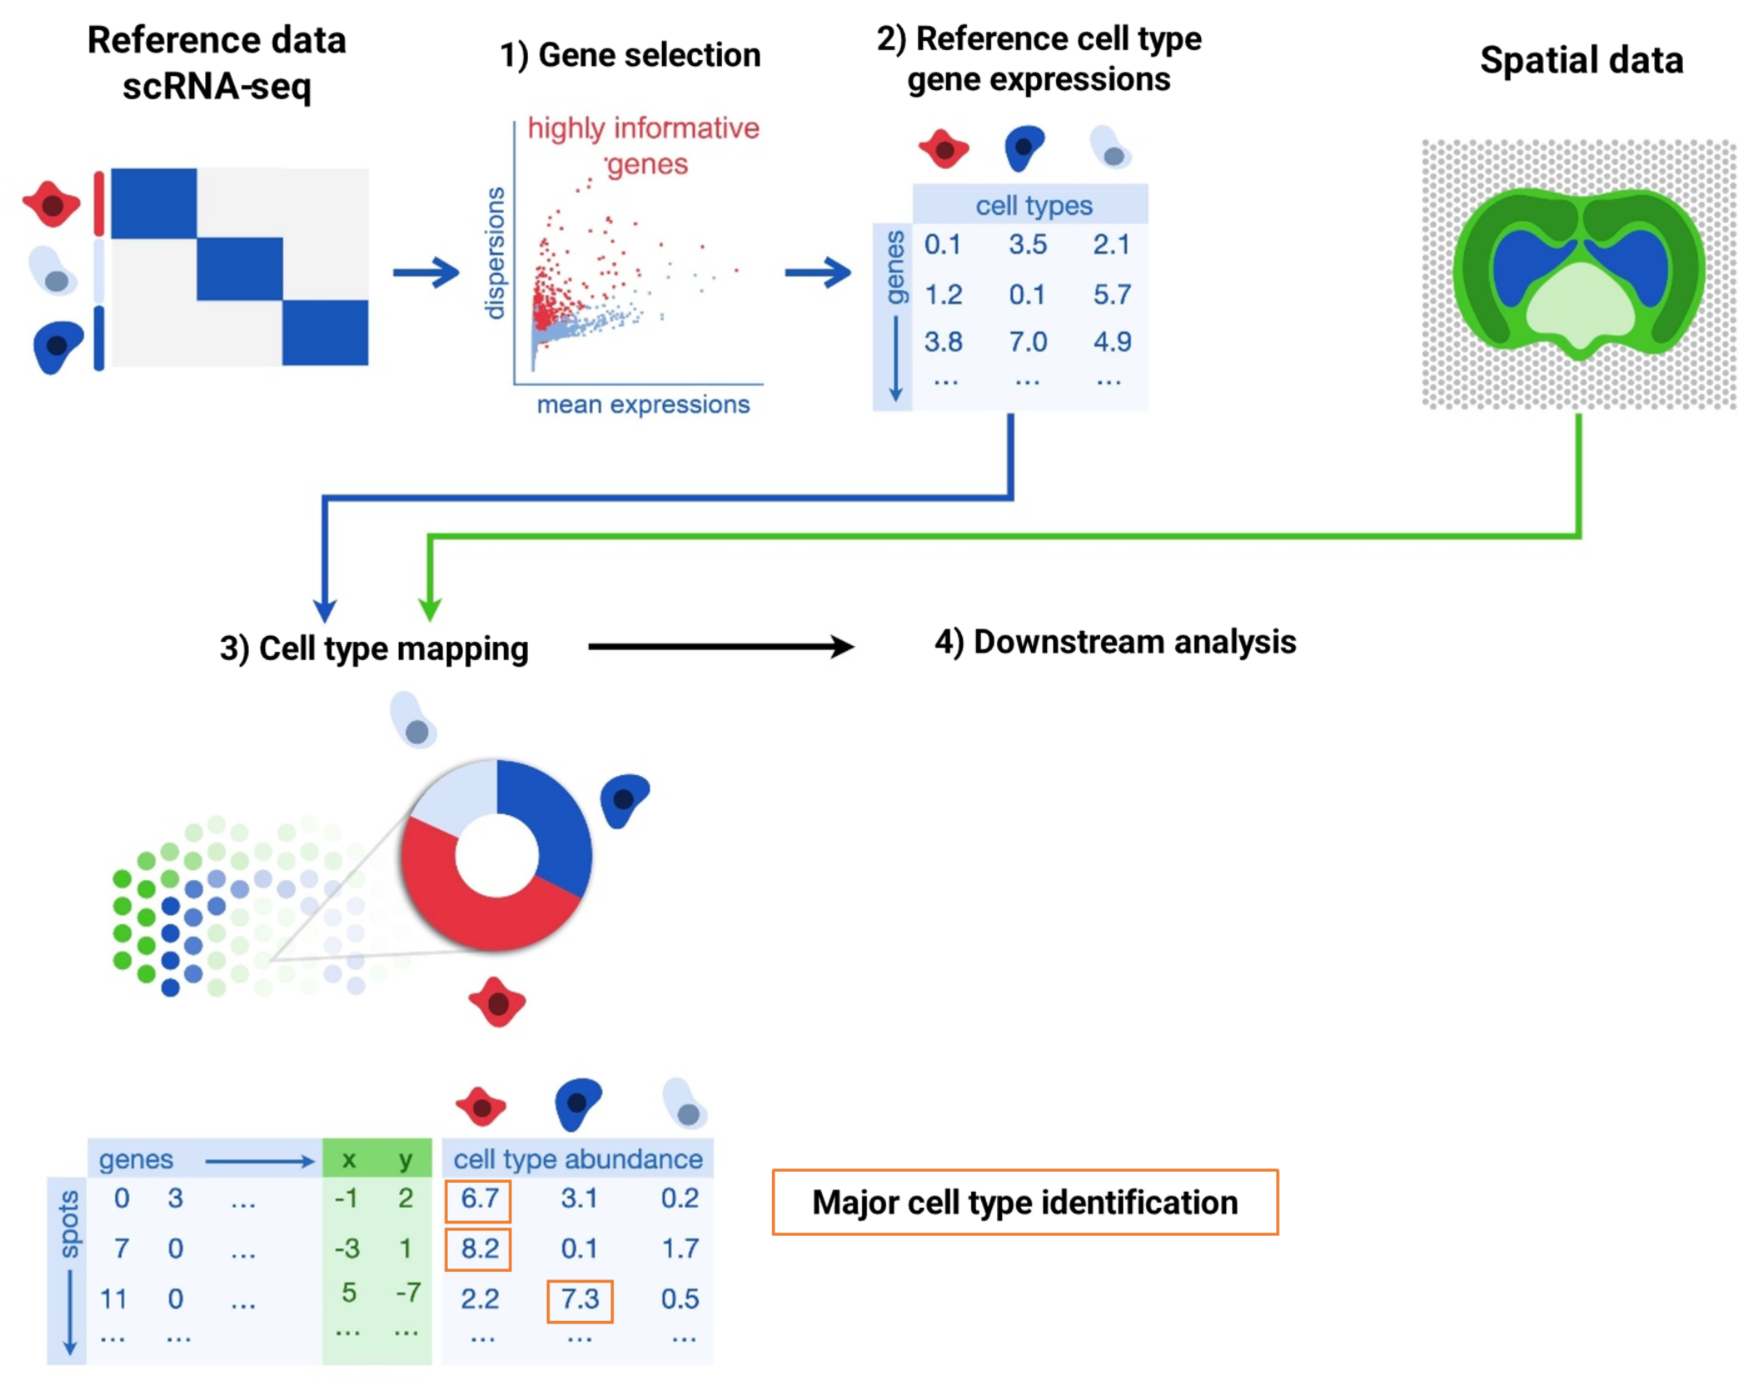
Figure 1 Cell type annotation in spatial transcriptomics
Cell type annotation algorithms utilizing single-cell reference data can be roughly divided into 3 categories, those based on probabilistic models, those employing non-negative matrix factorization (NMF), and other methods leveraging specifically designed loss functions. From existing benchmarks and review articles1–4 and our own experience, we selected 5 algorithms which are reported to have good performance for evaluation: RCTD5 and cell2location6 (probabilistic model-based) , SPOTlight7 and CARD8 (NMF-based), and Tangram9 (deep learning-based) (Table 1).
Table 1 Algorithms selected for evaluation
Algorithm | category | Gene feature | Key methods | Journal (year) | citations |
RCTD | Probabilistic | ~3k DEGs, gene expression | Poisson distribution, maximum likelihood | Nature Biotechnology (2022) | 804 |
cell2location | Probabilistic | 8k-16k genes, gene signatures | negative binomial distribution, variational Bayesian inference | Nature Biotechnology (2022) | 742 |
SPOTlight | NMF | ~3k HVGs, gene expression | NMF, non-negative least squares | Nucleic Acids Research (2021) | 518 |
CARD | NMF | Cell type marker genes, gene expression | NMF, conditional autoregression | Nature Biotechnology (2022) | 305 |
Tangram | Deep learning | ~200 marker genes per cell type, gene expression | self-constructed loss function | Nature Methods (2021) | 601 |
Ground truth annotations are usually simulated by Fluorescence in situ Hybridization (FISH) techniques, which are not available in sequencing-based spatial transcriptomics data such as Stereo-seq. To evaluate algorithm performance on Stereo-seq without ground truth, we employed 6 metrics:
1. Annotation%: The percentage of cells/bins that are annotated
2. PCCm2: Pearson's correlation between the predicted cell type composition matrix (P) and the marker gene expression matrix (E) (Fig. 2)
3. Marker Specificity: marker gene expression in an annotated cell type vs. other cell types (i.e. quantifying the marker genes plot)
4. PCCs1: Pearson’s correlation between single-cell (X) and spatial (Y) average gene expression in each cell type (Fig. 2)
5. KLD1: KL divergence between Y and X (Fig. 2)
6. SSIM1: structural similarity between Y and X (Fig. 2)
PCCm measures how well the proportion of cell types in bins/spots is predicted. Marker Specificity, PCCs, KLD, and SSIM measure how well the major cell type of bins/spots is annotated. We believe that PCCm and Marker Specificity are more reliable metrics because they depend solely on marker genes. In contrast, PCCs, KLD, and SSIM incorporate all detected genes, which can introduce more noise.
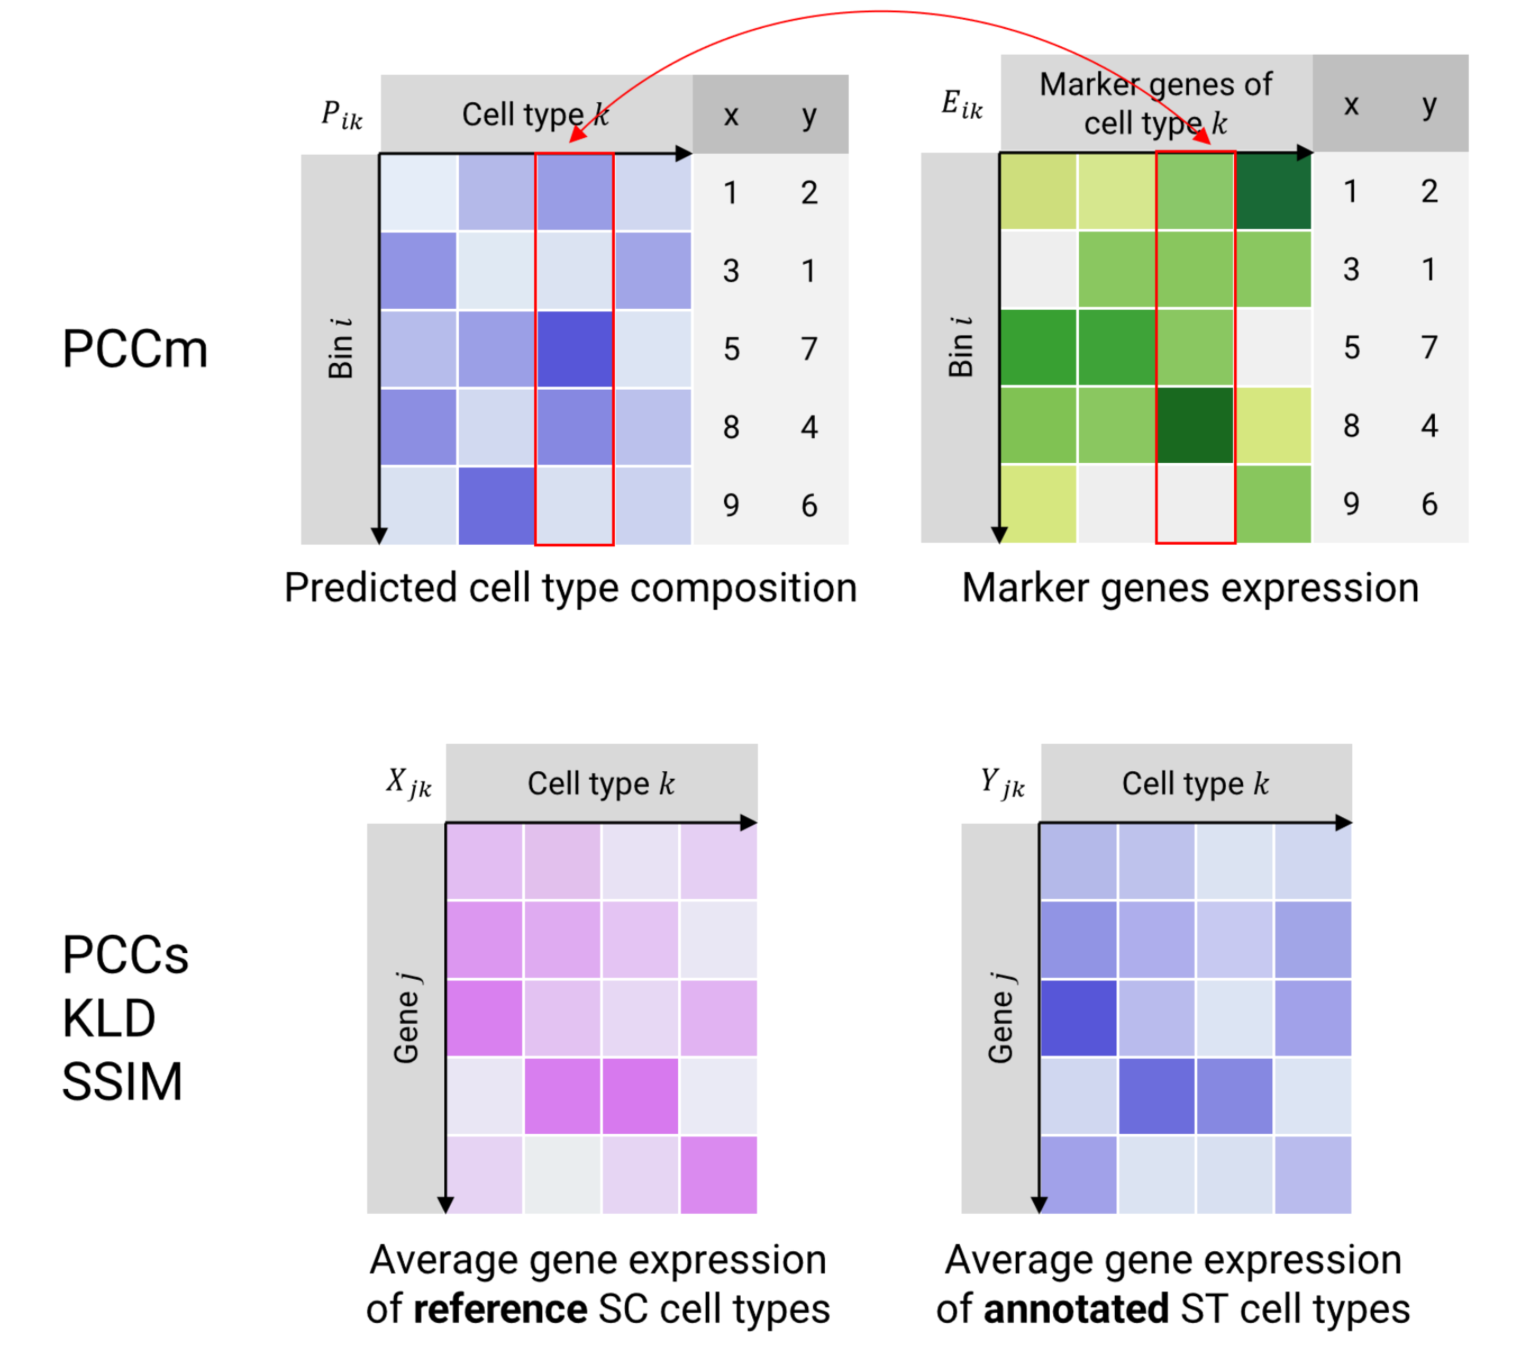
Figure 2 Illustrations of evaluation metrics
We evaluated the performance of 5 cell type annotation algorithms across 11 Stereo-seq samples, spanning mouse brain, human colorectal cancer, liver cancer, breast cancer, and gastric cancer.
Cell2location demonstrates superior performance in both cell type proportion prediction and major cell type identification, achieving the highest PCCm and Marker Specificity scores overall. RCTD delivers near-optimal performance in bin20 and cellbin analyses when excluding unannotated bins/cells. Tangram shows comparable performance to cell2location and RCTD specifically in bin20 analyses. SPOTlight ranks fourth in both PCCm and Marker Specificity metrics. CARD performs least effectively, ranking fifth and failing to complete bin20 or cellbin analyses due to memory limitations (Fig. 3). Additionally, RCTD and SPOTlight lead in PCCs and SSIM metrics, while Tangram achieves the lowest KL divergence scores (Fig. 4).
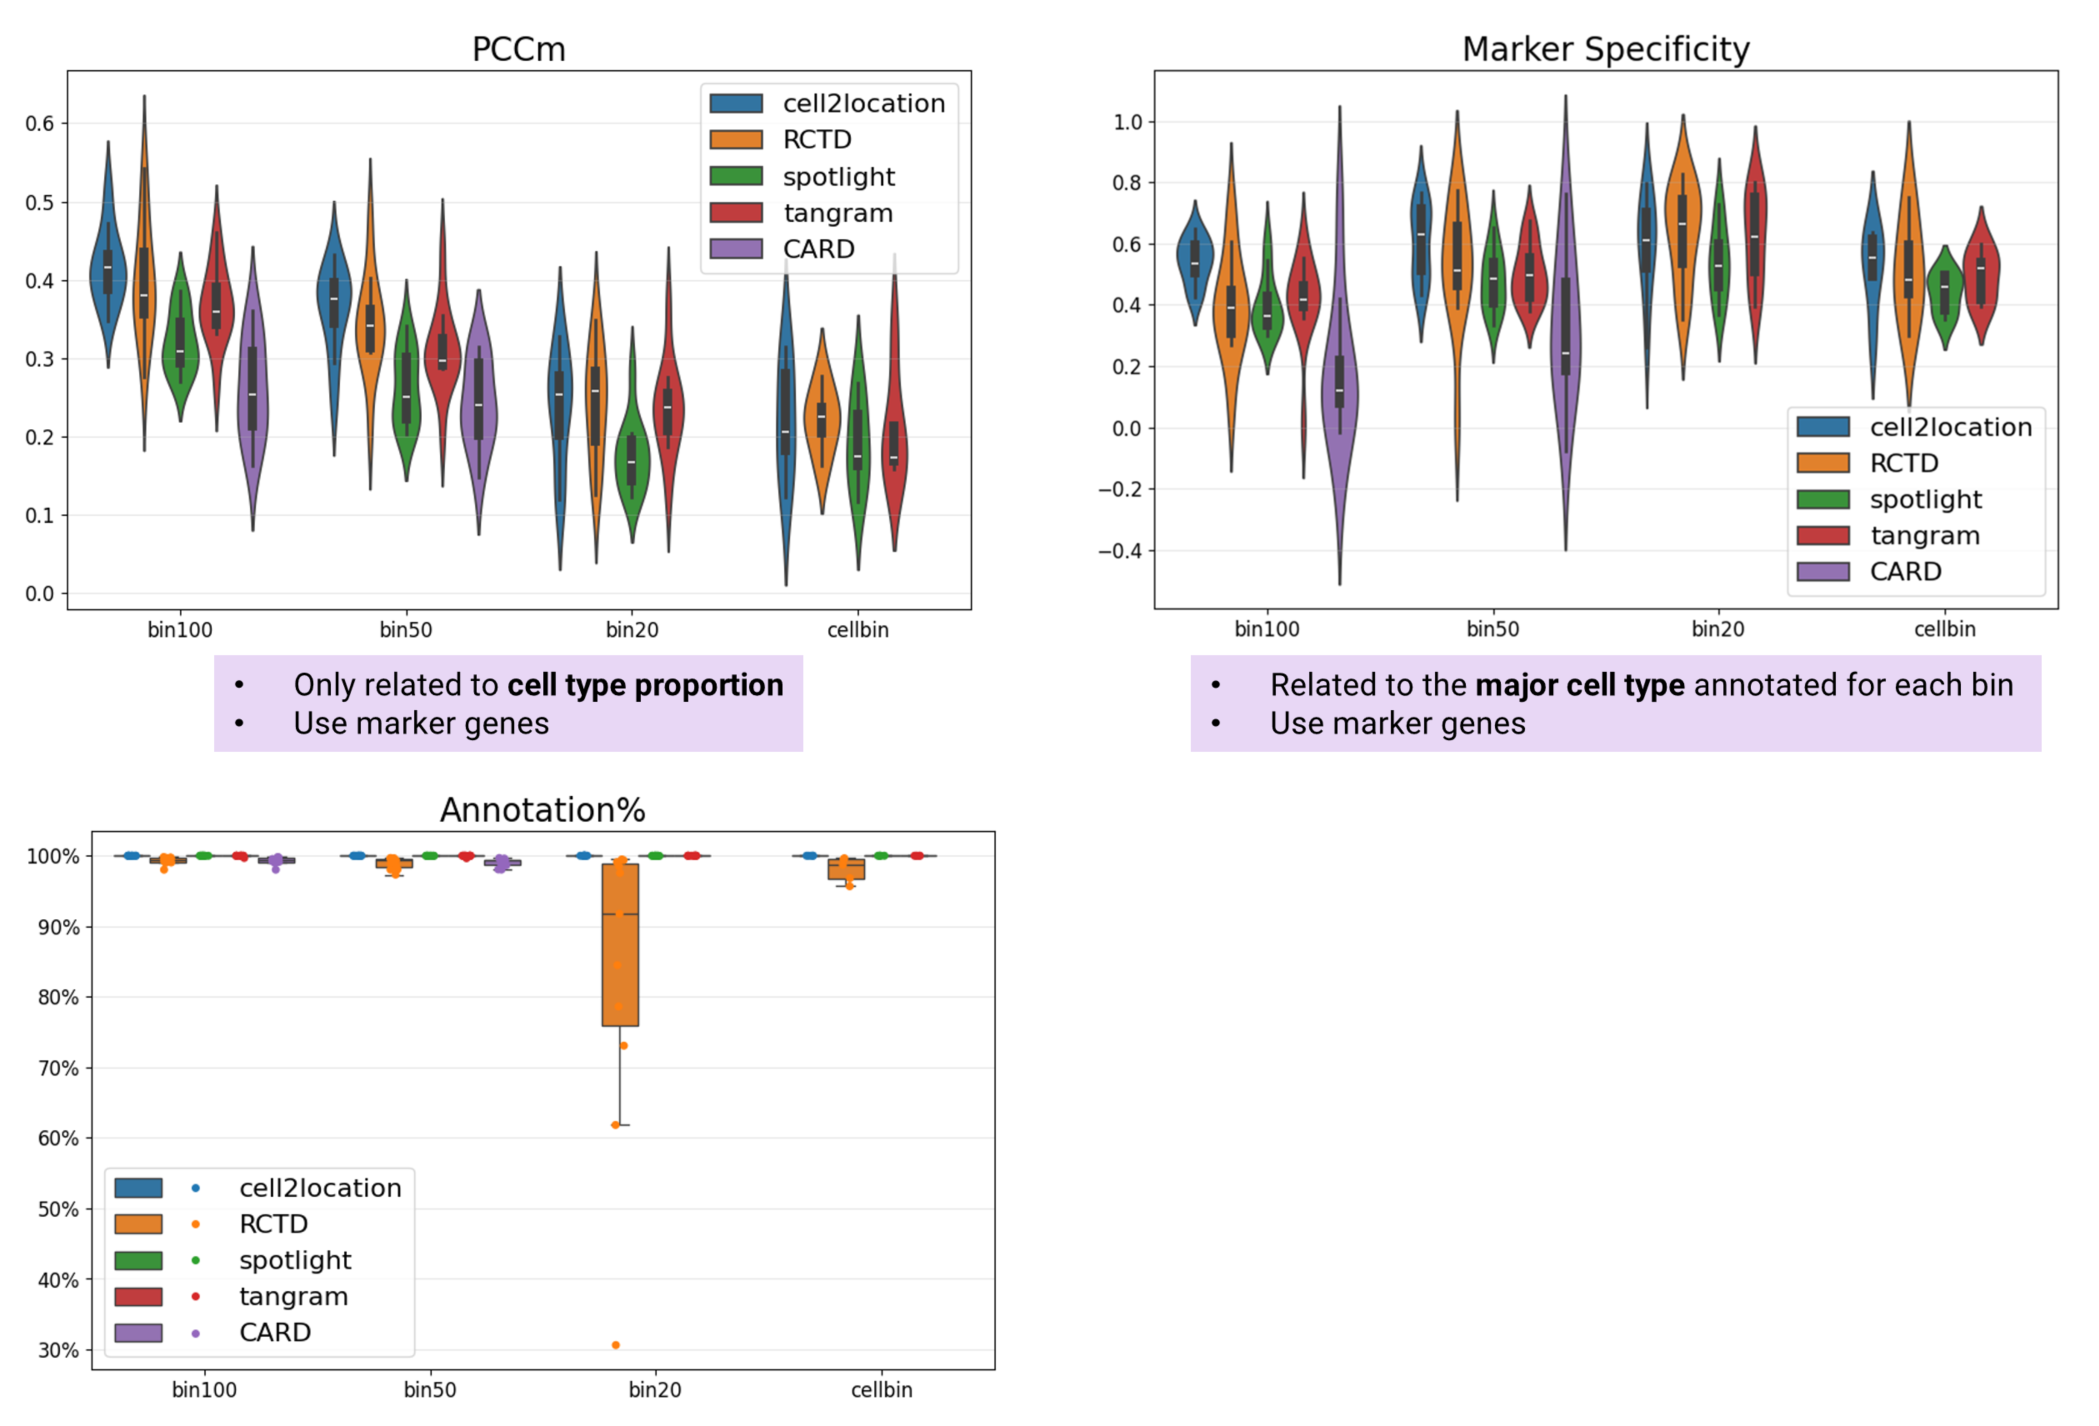
Figure 3 PCCm, Marker Specificity, and Annotation% of selected algorithms
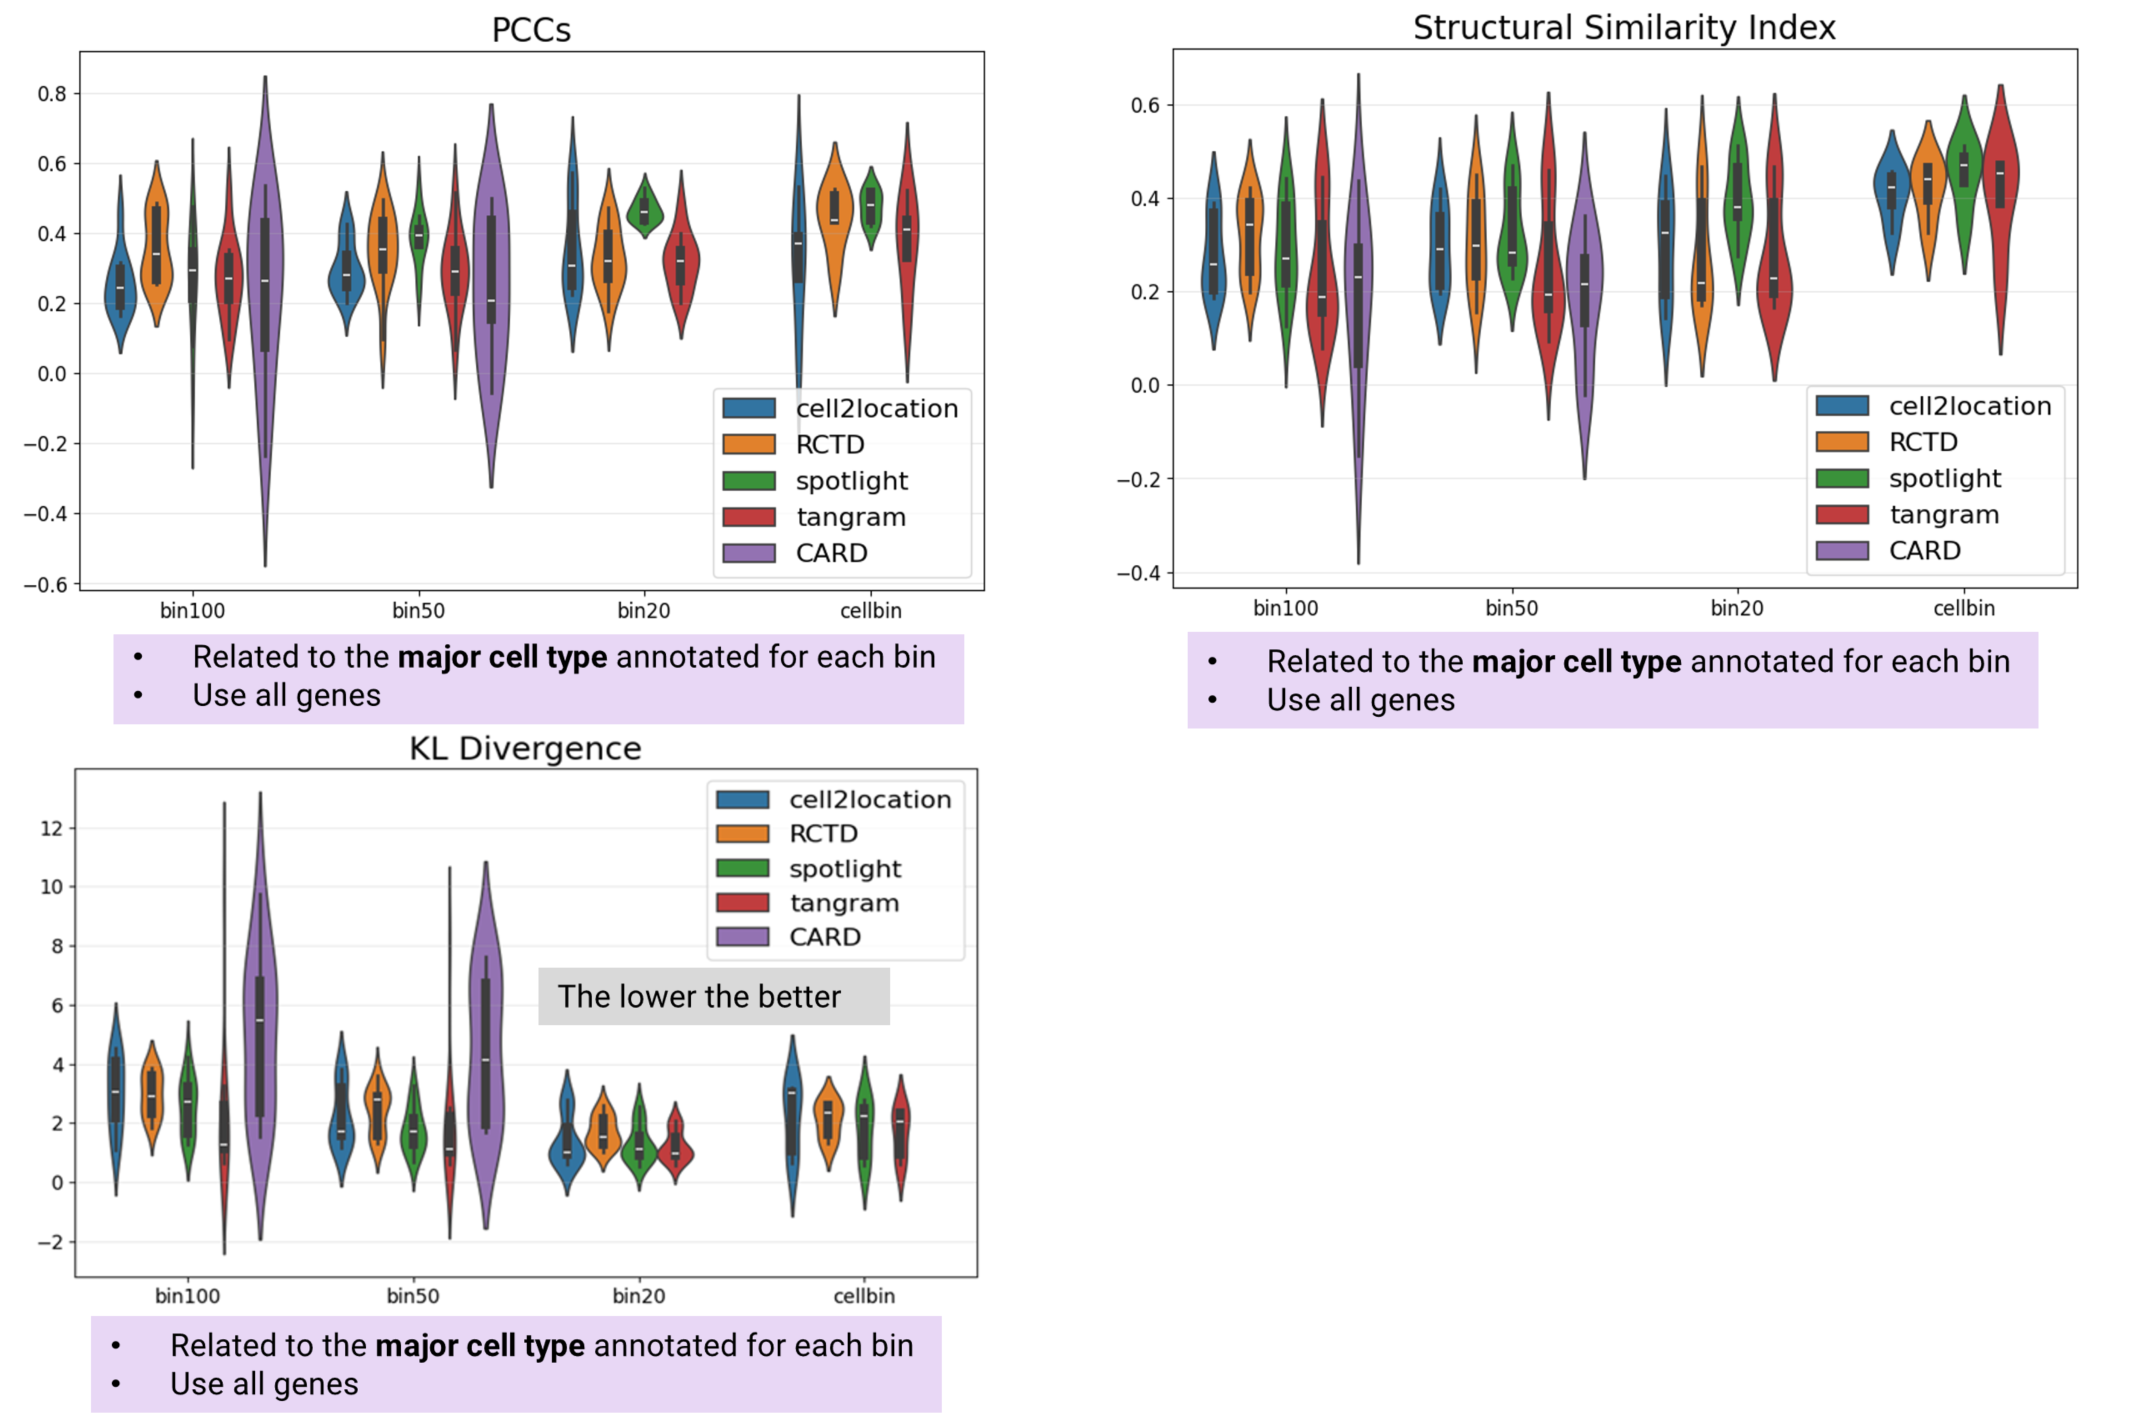
Figure 4 PCCs, SSIM, and KLD of selected algorithms
Beyond annotation accuracy, computational efficiency is critical for analyzing large-scale Stereo-seq data. We summarize the time and memory requirements for each algorithm below:
Cell2location exhibits the longest runtime, even with GPU acceleration, and requires substantial memory. SPOTlight runs faster than cell2location but consumes more memory. RCTD runs significantly faster than cell2location and is notably quicker than SPOTlight at bin100 and bin50 resolutions. Furthermore, RCTD's memory consumption scales more efficiently with increasing data size. Tangram shows the lowest resource demands, requiring minimal time and memory even without GPU acceleration. Although CARD is also fast, it has the highest memory usage, failing to complete bin20 and cellbin analyses within a 500GB memory limit (Fig. 5).
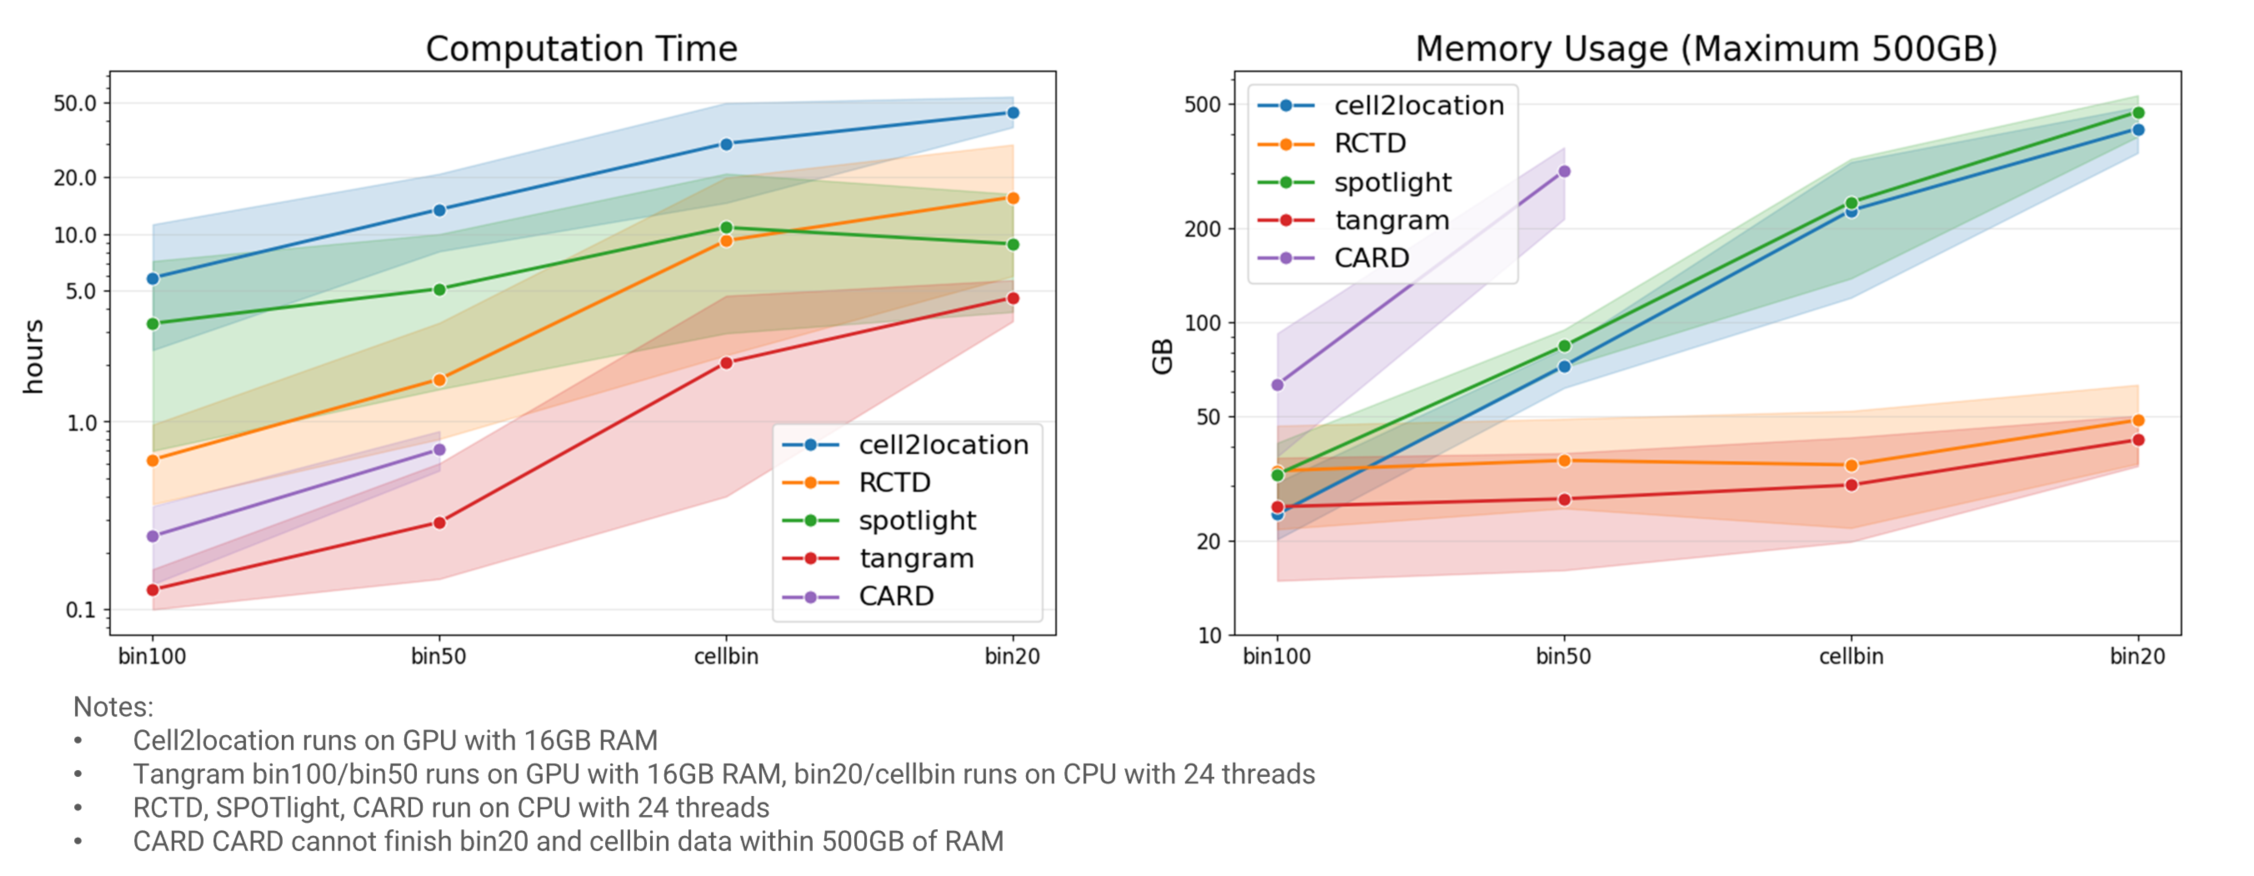
Figure 5 Computation cost of selected algorithms
We take this human colorectal cancer sample as an example to demonstrate the effect of bin size in cell type annotation. The marker genes plot reveals the clearest diagonal pattern in bin20 annotations, indicating its superior suitability for major cell type identification compared to bin50 and bin100. This is because bin50 and bin100 usually contain a mix of different cell types, whereas bin20 is closer to the size of a single cell. This observation aligns with the decreasing trend in Marker Specificity from bin20 to bin100 (Fig. 6).
However, the PCCm metric exhibits an inverse relationship with bin size. Unlike Marker Specificity, PCCm evaluates the performance of cell type proportion prediction without requiring major cell type identification. In this context, gene count – which increases with larger bin sizes – becomes the dominant factor driving PCCm improvement. This effect is more obvious in the cell type proportion plots, where patterns grow increasingly distinct from bin20 to bin100 (Fig. 6).
As a result, we believe that bin20 is more suitable for major cell type identification because its size is closer to that of a single cell. Meanwhile, for low quality samples, we recommend using bin100 for cell type proportion prediction due to its high gene count.
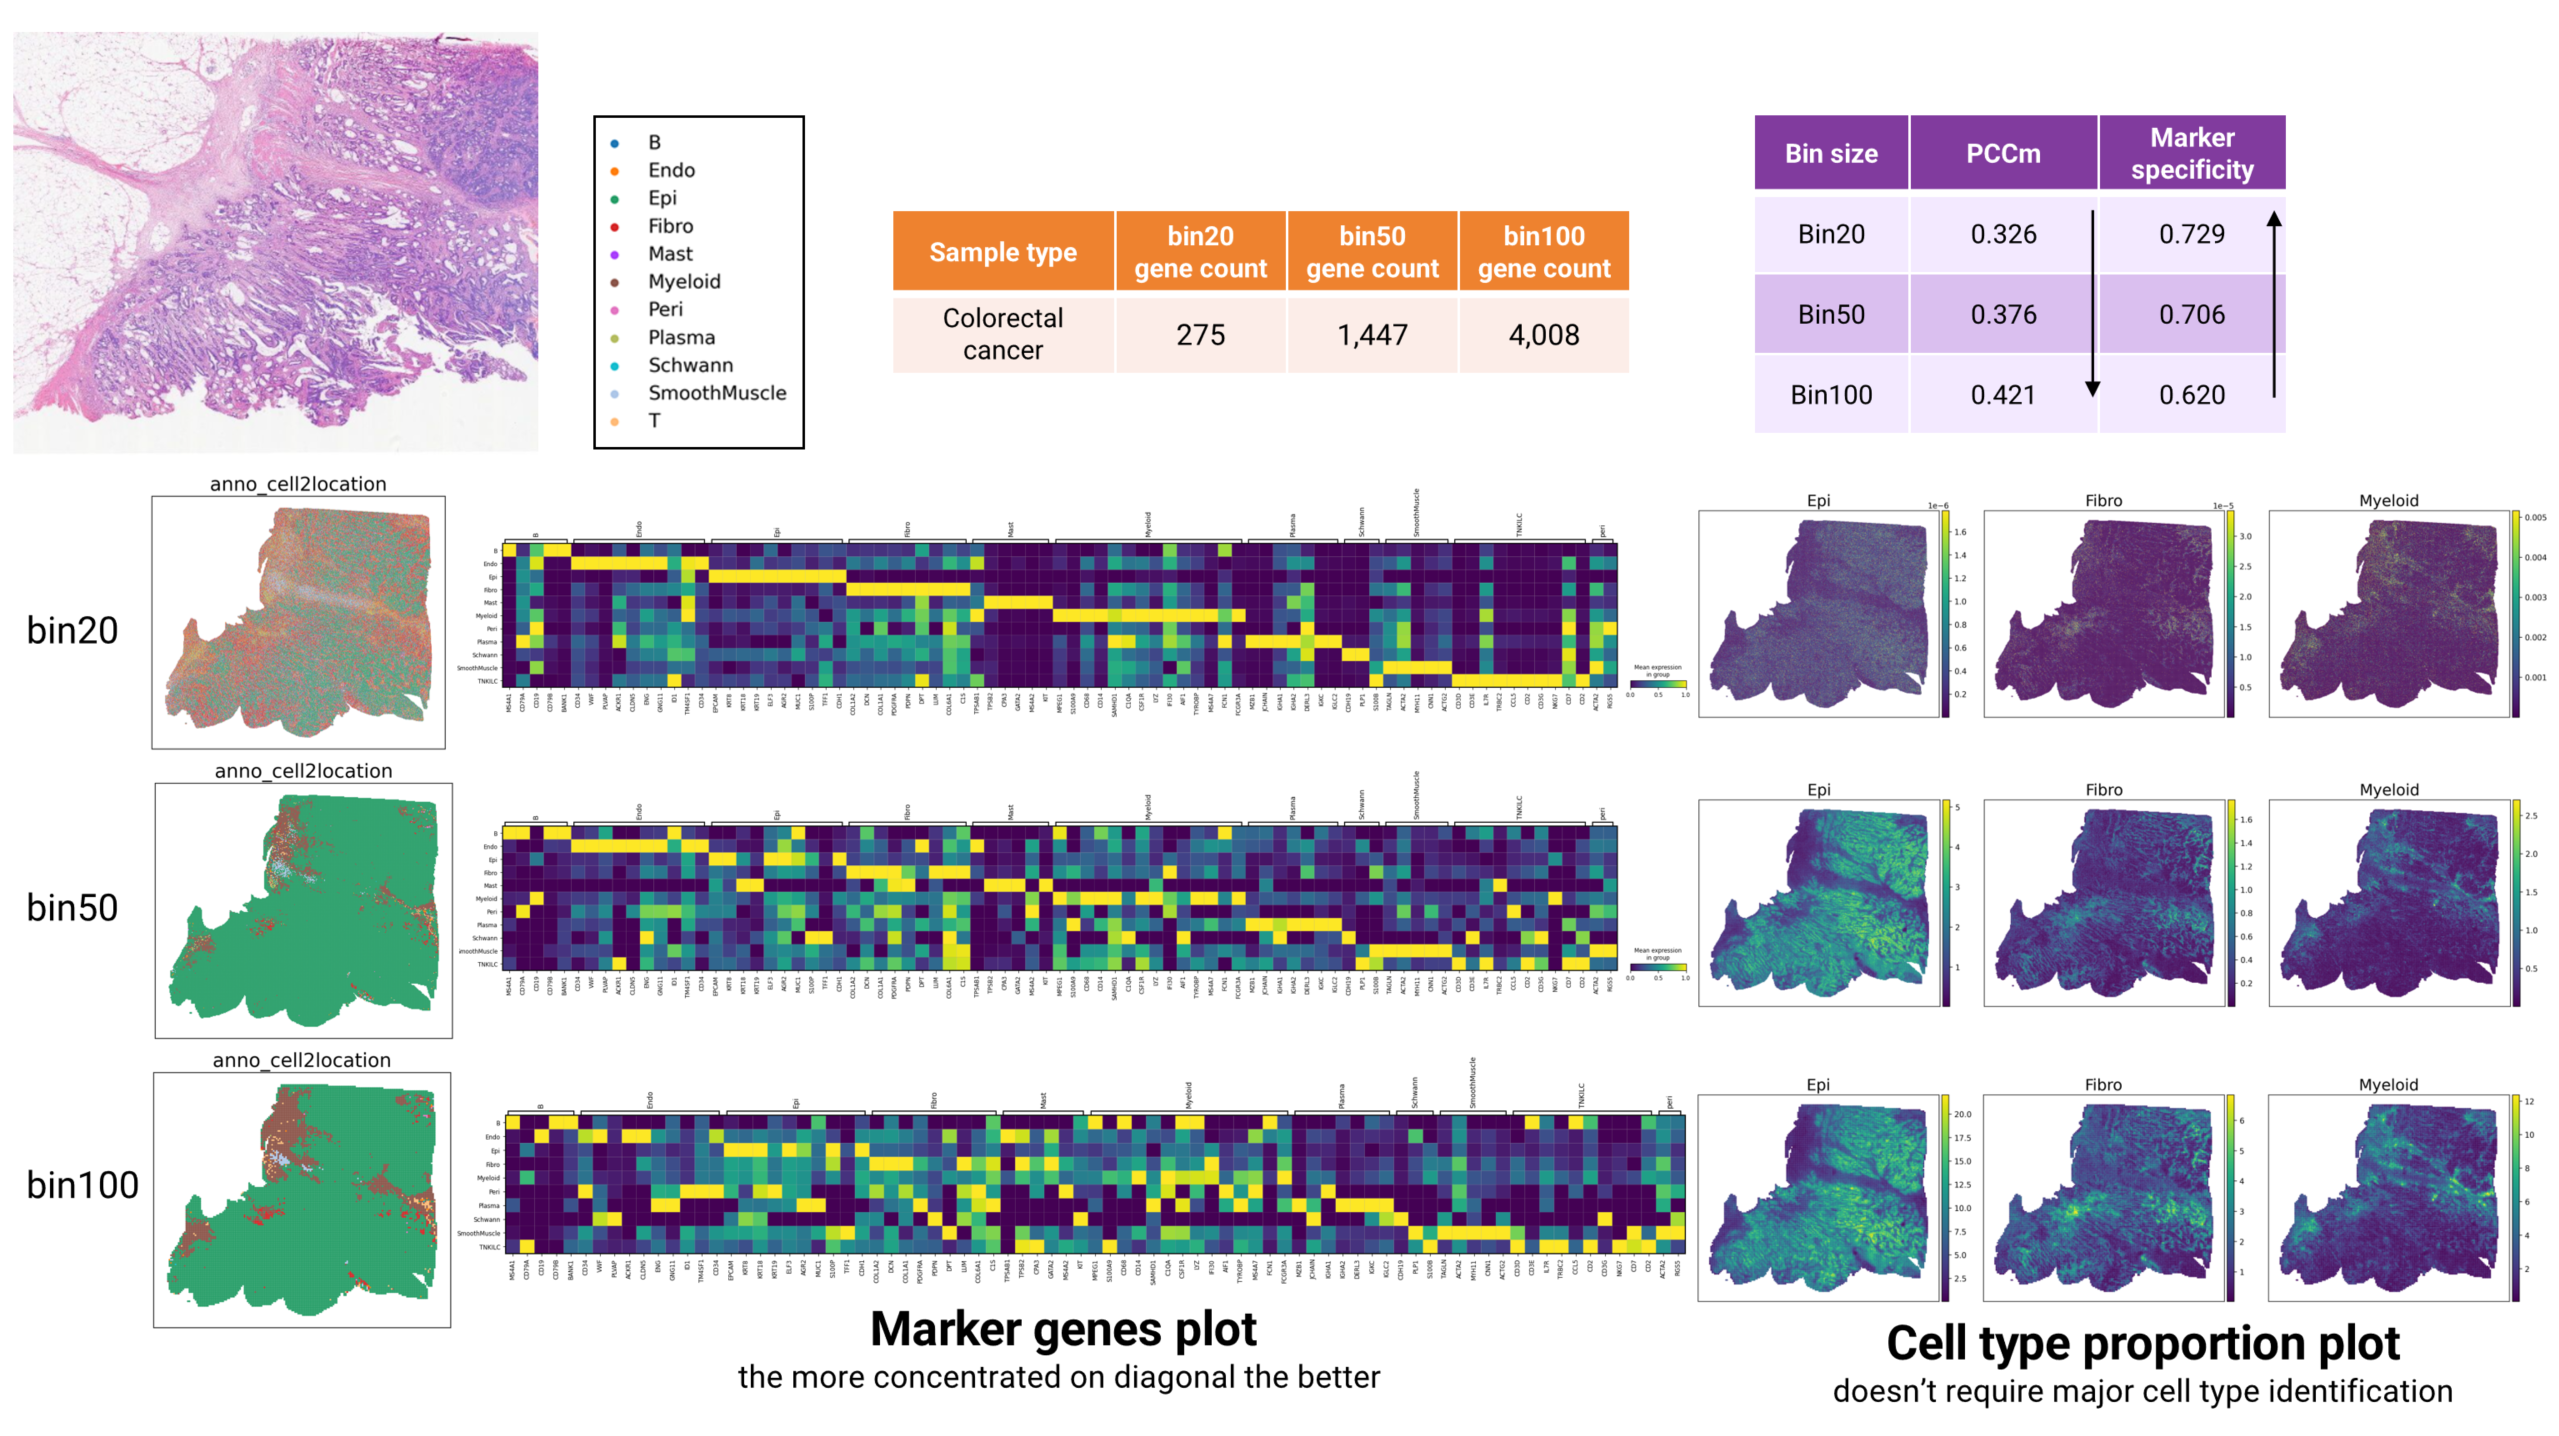
Figure 6 The effect of bin size in annotation
For high-quality datasets such as this mouse brain sample, all evaluated algorithms can generate biologically plausible annotations, even at the cellbin resolution. Distinct structures including the hippocampus, cortex, and thalamus are consistently resolved. Cell2location and RCTD achieve the top performance based on PCCm and Marker Specificity metrics. Regarding computational efficiency, cell2location has the longest runtime and requires memory exceeding 150GB. RCTD and Tangram demonstrate more favorable efficiency, with a runtime of less than 3 hours and memory usage of less than 30 GB (Fig. 7).
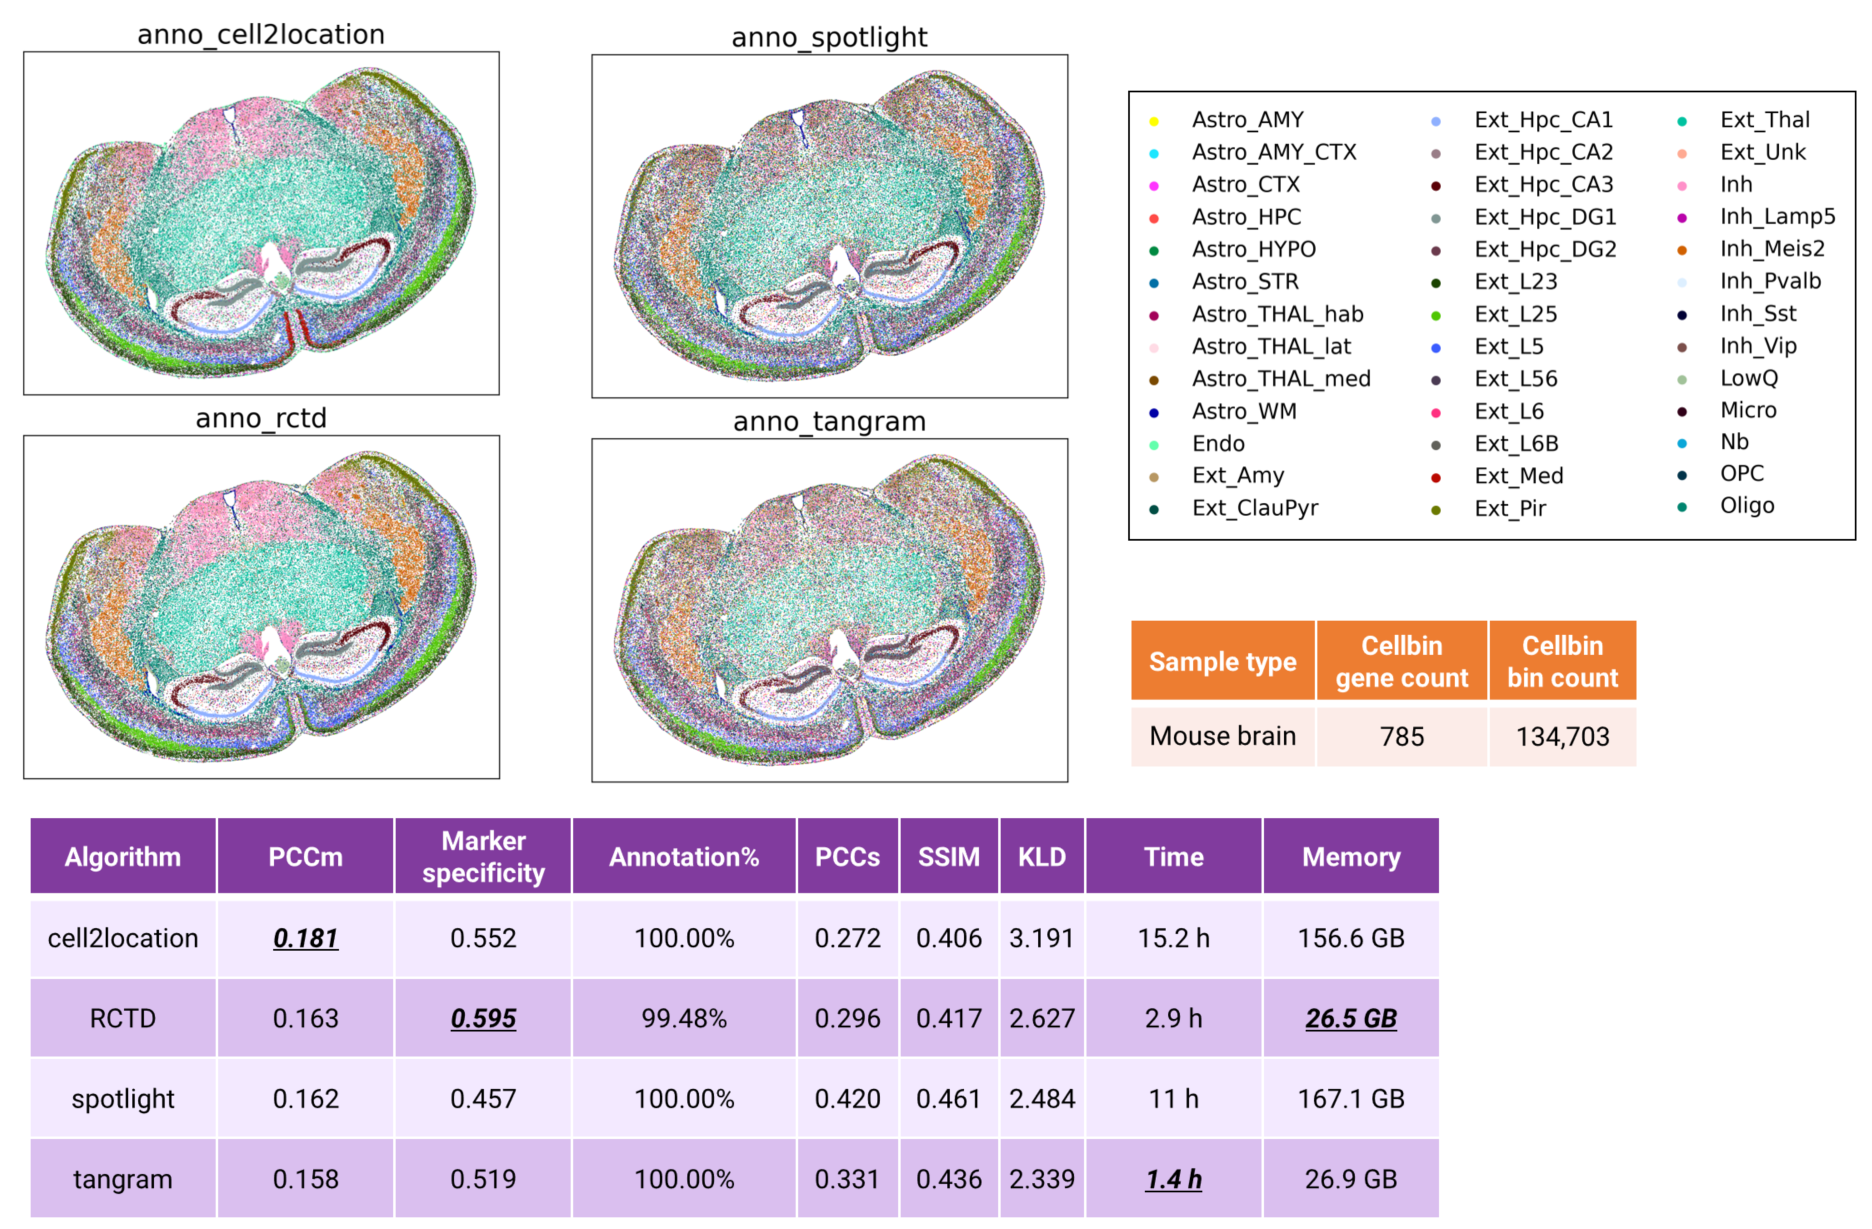
Figure 7 Cell type annotation of mouse brain cellbin data
Despite low median gene counts (98 genes) in bin20 data, immune cells in this human colorectal cancer sample remain annotatable. Cell2location successfully identified B cells and T cells in the large top-left region, localized B cell aggregates among goblet cells, and detected immune populations adjacent to smooth muscle. These findings are visually consistent across both major cell type and cell type proportion plots. Marker gene expression patterns further confirms the high-quality of immune cell annotations (Fig. 8).
In addition to cell2location, RCTD, SPOTlight, and Tangram also successfully annotated these immune populations. Metric evaluation reveals that RCTD achieves superior performance, followed by cell2location and Tangram. However, RCTD annotated only about 73% of bins (Fig. 8). This is because RCTD automatically filters low quality data points with default parameters.
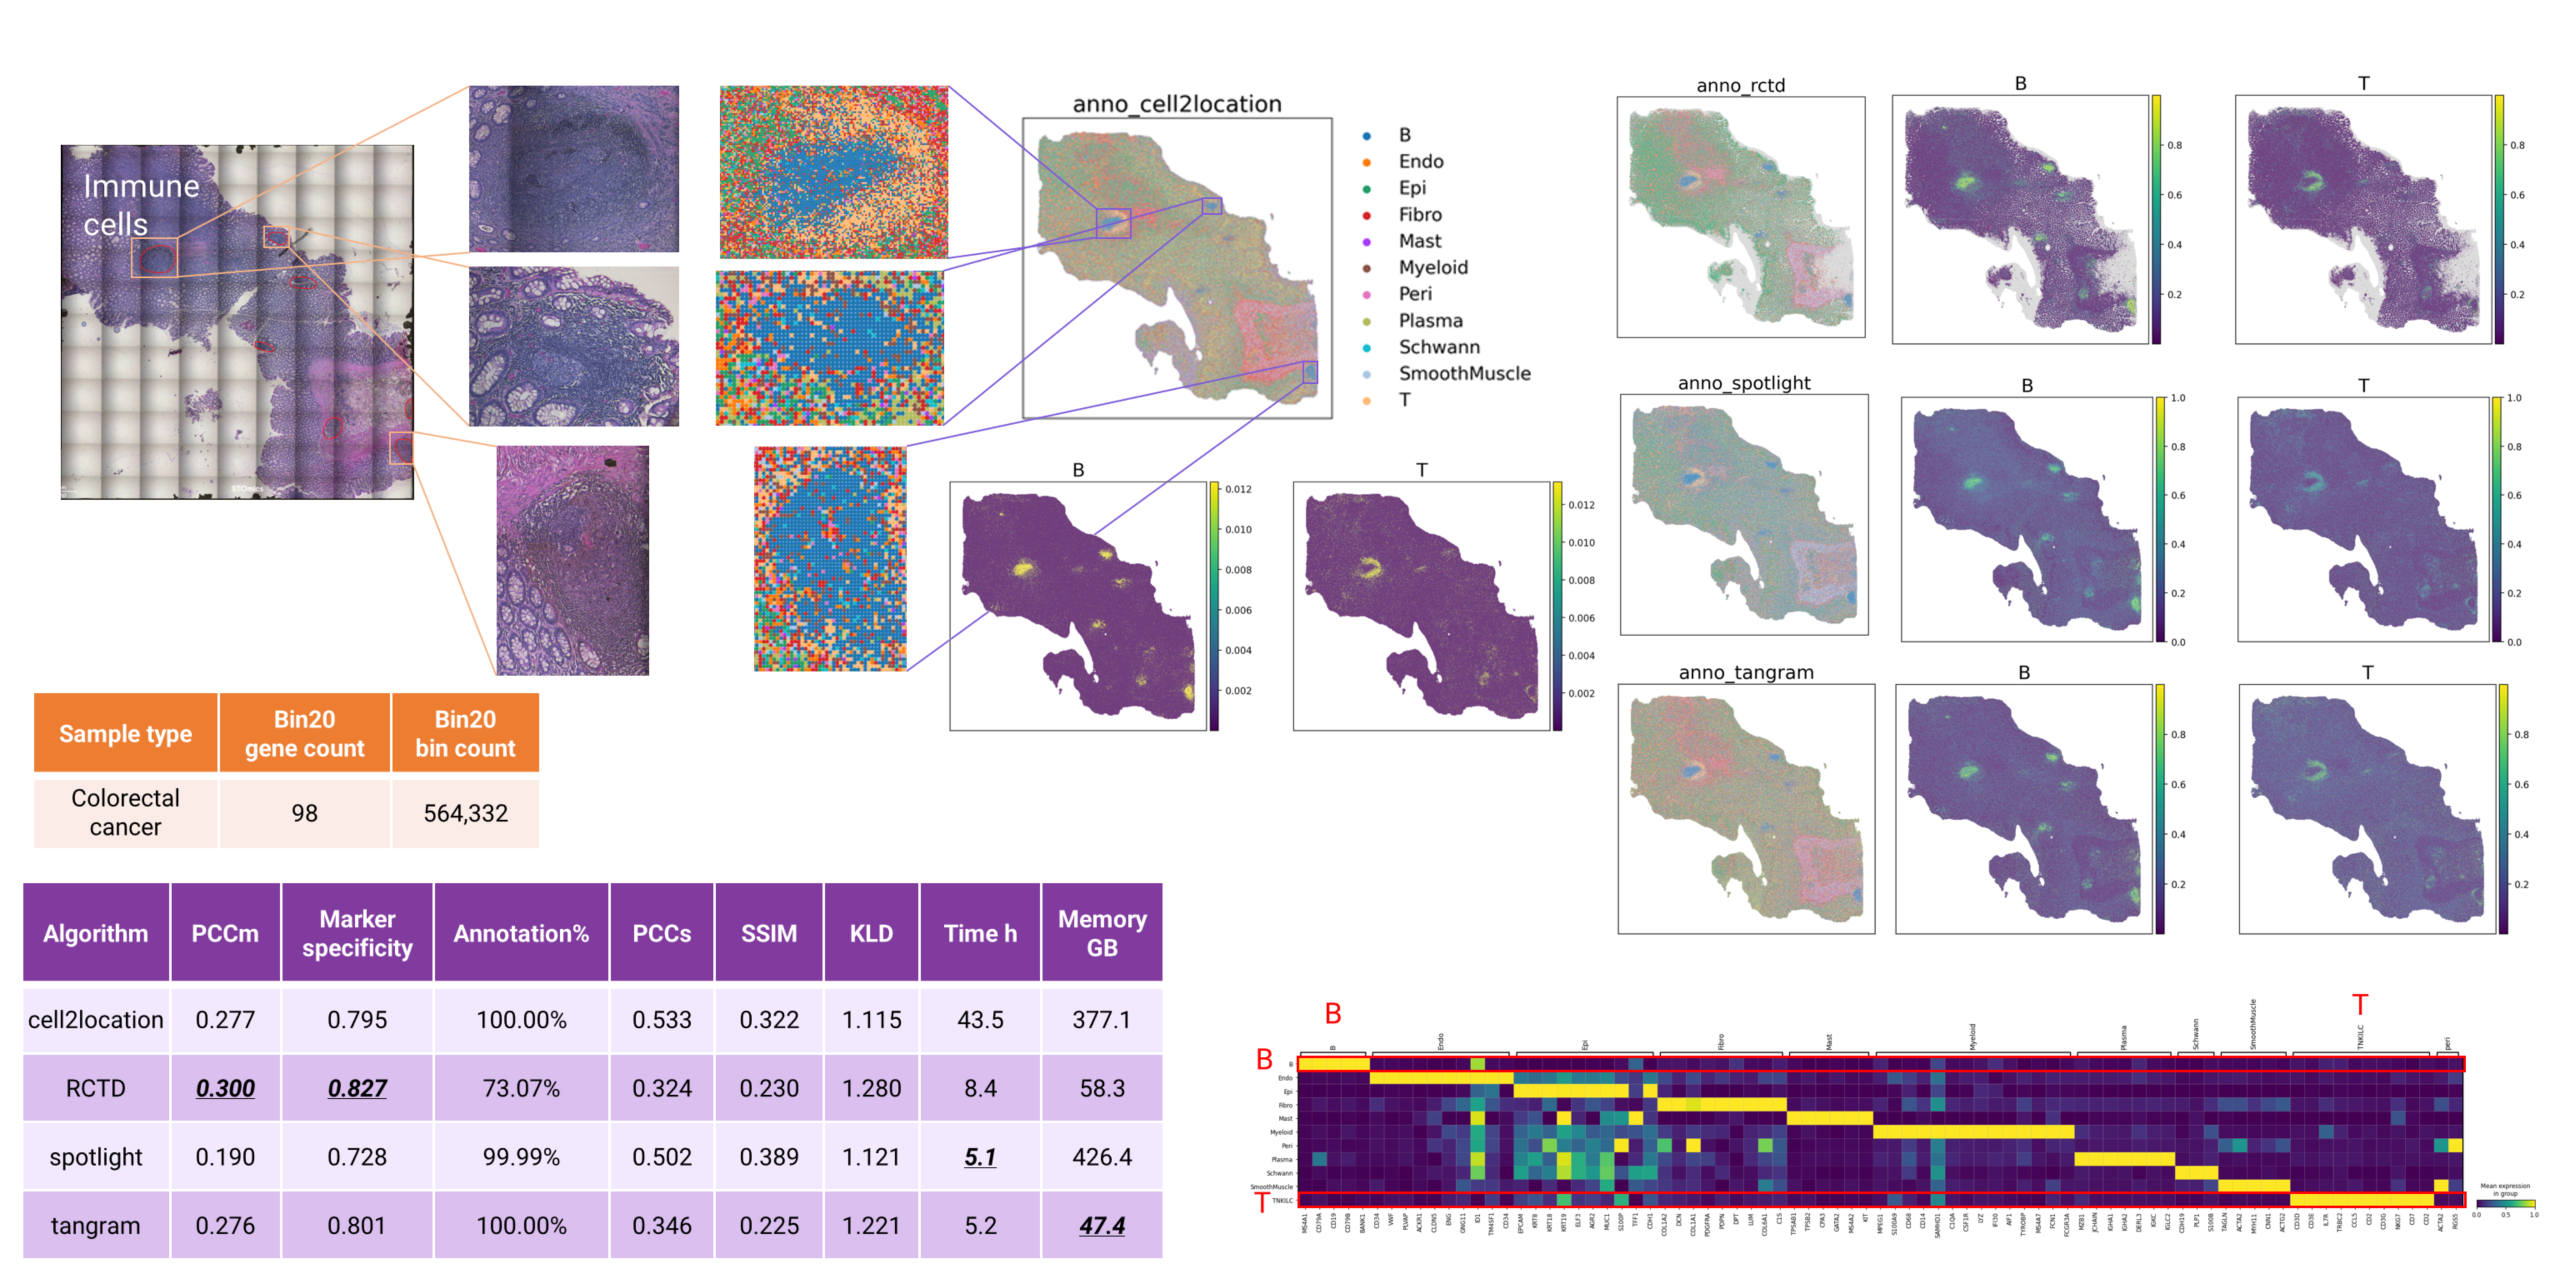
Figure 8 cell type annotation of human colorectal cancer bin20 data
Given its strong performance, cell2location is generally the top choice when GPU is available and longer runtime is acceptable. For more computationally efficient options, RCTD and Tangram are recommended alternatives. However, when analyzing bin20 or cellbin data with low gene counts, Tangram is recommended over RCTD due to its high annotation rate. If these methods cannot yield the expected quality in your analysis, exploring other algorithms may be worthwhile too.
Table 2 summary of evaluated algorithms
Algorithm | Performance | Memory | Time | GPU Acceleration |
cell2location | ⭐⭐⭐⭐⭐ | ⭐⭐⭐ | ⭐ | Extremely slow without GPU |
RCTD | ⭐⭐⭐⭐ (excluding unannotated cells) | ⭐⭐⭐⭐ | ⭐⭐⭐ | |
Tangram | ⭐⭐⭐ | ⭐⭐⭐⭐⭐ | ⭐⭐⭐⭐⭐ | Fast on CPU, can be accelerated with GPU |
SPOTlight | ⭐⭐ | ⭐⭐ | ⭐⭐ | |
CARD | ⭐ | ⭐ | ⭐⭐⭐⭐ |
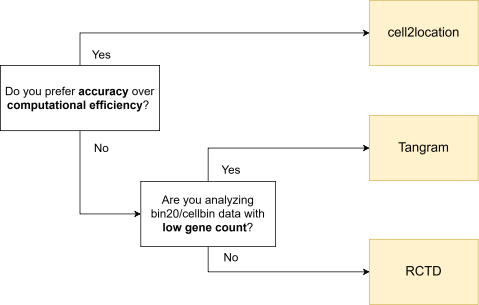
Figure 9 Recommendation of cell type annotation algorithms
1. Tao, Q. et al. Benchmarking mapping algorithms for cell-type annotating in mouse brain by integrating single-nucleus RNA-seq and Stereo-seq data. Brief. Bioinform. 25, bbae250 (2024).
2. Li, H. et al. A comprehensive benchmarking with practical guidelines for cellular deconvolution of spatial transcriptomics. Nat. Commun. 14, 1548 (2023).
3. Chen, J. et al. A comprehensive comparison on cell-type composition inference for spatial transcriptomics data. Brief. Bioinform. 23, bbac245 (2022).
4. Li, B. et al. Benchmarking spatial and single-cell transcriptomics integration methods for transcript distribution prediction and cell type deconvolution. Nat. Methods 19, 662–670 (2022).
5. Cable, D. M. et al. RCTD: Robust decomposition of cell type mixtures in spatial transcriptomics. Nat. Biotechnol. 40, 517–526 (2022).
6. Kleshchevnikov, V. et al. Cell2location maps fine-grained cell types in spatial transcriptomics. Nat. Biotechnol. 40, 661–671 (2022).
7. Elosua-Bayes, M., Nieto, P., Mereu, E., Gut, I. & Heyn, H. SPOTlight: seeded NMF regression to deconvolute spatial transcriptomics spots with single-cell transcriptomes. Nucleic Acids Res. 49, e50 (2021).
8. Ma, Y. & Zhou, X. CARD: Spatially informed cell-type deconvolution for spatial transcriptomics. Nat. Biotechnol. 40, 1349–1359 (2022).
9. Biancalani, T. et al. Tangram: Deep learning and alignment of spatially resolved single-cell transcriptomes with Tangram. Nat. Methods 18, 1352–1362 (2021).
Author:
![]() Dr. Zheng Zhong, Associate Research Fellow in Bioinformatics at STOmics Tech
Dr. Zheng Zhong, Associate Research Fellow in Bioinformatics at STOmics Tech