All
Products
Resources
News
FAQ
Search


$ cat /path/to/output/01.mapping/E100026571_L01_trim_read_1_barcodeMap.stat ...
getBarcodePositionMap_uniqBarcodeTypes: 645784920
total_reads:                            1002214171
reads_with_polyA:                   	131113905       13.08%
reads_filteredByPolyA:                  22008148        2.20%
mapped_reads:                           826344259       82.45%
reads_with_adapter:                     9007116         0.90%
reads_with_dnb:                         42264284        4.22%
barcode_exactlyOverlap_reads:           682746301       68.12%
barcode_misOverlap_reads:               143590127       14.33%
barcode_withN_reads:                    7831            0.00%
reads_with_rRNA:                        0               0.00%
Q10_bases_in_barcode:                                   99.54%
Q20_bases_in_barcode:                                   97.49%
Q30_bases_in_barcode:                                   91.74%
Q10_bases_in_umi:                                       99.26%
Q20_bases_in_umi:                                       96.32%
Q30_bases_in_umi:                                       89.45%
Q10_bases_in_seq:                                       99.47%
Q20_bases_in_seq:                                       97.12%
Q30_bases_in_seq:                                       91.08%
umi_filter_reads:                       8265089         0.82%
umi_with_N_reads:                       13025           0.00%
umi_with_polyA_reads:                   12365           0.00%
umi_with_low_quality_base_reads:        8239699         0.82%
mapped_dnbs: 75619113
...
1.2 Statistical Report for Reference Genome Alignment
$ cat /path/to/output/01.mapping/E100026571_L01_trim_read_1.Log.final.out
...
                      Number of input reads |        769052654
                  Average input read length |        95
                                UNIQUE READS:
               Uniquely mapped reads number |        645319822
                    Uniquely mapped reads % |        83.91%
                      Average mapped length |        95.14
                   Number of splices: Total |        67634124
        Number of splices: Annotated (sjdb) |        65711163
                   Number of splices: GT/AG |        66445242
                   Number of splices: GC/AG |        457783
                   Number of splices: AT/AC |        41573
           Number of splices: Non-canonical |        689526
                  Mismatch rate per base, % |        0.50%
                     Deletion rate per base |        0.07%
                    Deletion average length |        3.91
                    Insertion rate per base |        0.03%
                   Insertion average length |        1.25
                         MULTI-MAPPING READS:
    Number of reads mapped to multiple loci |        87828411
         % of reads mapped to multiple loci |        11.42%
    Number of reads mapped to too many loci |        5333051
          % of reds mapped to too many loci |        0.69%
                              UNMAPPED READS:
Number of reads unmapped: too many mismatches |        0
   % of reads unmapped: too many mismatches |        0.00%
        Number of reads unmapped: too short |        29365488
             % of reads unmapped: too short |        3.82%
            Number of reads unmapped: other |        1205882
                 % of reads unmapped: other |        0.16%
                              CHIMERIC READS:
                   Number of chimeric reads |        0
                        % of chimeric reads |        0.00%
$ samtools view /path/to/output/01.mapping/E100026571_L01_trim_read_1.Aligned.sortedByCoord.out.bam | head -2
  E100026571L1C007R00303973559    256     1       3000644 3       100M    *       0       0       GCCTCATTGTGCCCCATATGTTTGCCTATGTTGTGGACTTATTTTCATTAAACTTTAAAACATCTTTAATTTTTTTCTTTATTTCATCATTGACCAAGCT    -FCA9D?GFFD<-D<cgfegd-dg*fgfdfbe;e(9bgge38fffg9gg;0?ggfgb?e@g:ggg3gf79f0ggdg?g
$ head /path/to/output/02.merge/SS200000135TL_D1.merge.barcodeReadsCount.txt
  7127    18002   48
  4348    19028   1
  14130   8635    1
  7618    14537   24
  4912    10945   5
  16783   12914   1
  15539   8177    1
  9288    8082    14
  7274    16533   59
  9087    10657   10
3.1 Statistical Report for MID Filtering and Gene Annotation
$ cat /path/to/output/03.count/SS200000135TL_D1.Aligned.sortedByCoord.out.merge.q10.dedup.target.bam.summary.stat
## FILTER & DEDUPLICATION METRICS
TOTAL_READS     PASS_FILTER     ANNOTATED_READS UNIQUE_READS    FAIL_FILTER_RATE        FAIL_ANNOTATE_RATE      DUPLICATION_RATE
733148233       645319822       533743961       108363128       11.98   17.29   79.70
## ANNOTATION METRICS
TOTAL_READS     MAP             EXONIC          INTRONIC        INTERGENIC      TRANSCRIPTOME   ANTISENSE
645319822       645319822       484480416       49263545        111575861       533743961       110185975
100.0           100.0           75.1            7.6             17.3            82.7            17.1
$ samtools view /path/to/output/03.count/SS200000135TL_D1.Aligned.sortedByCoord.out.merge.q10.dedup.target.bam | head -2
E100026571L1C007R00303973559    768     1       3000644 3       100M    *       0       0       GCCTCATTGTGCCCCATATGTTTGCCTATGTTGTGGACTTATTTTCATTAAACTTTAAAACATCTTTAATTTTTTTCTTTATTTCATCATTGACCAAGCT    -FCA9D?GFFD<-D<CGFEGD-DG*FGFDFBE;E(9BGGE38FFFG9GG;0?GGFGB?E@G:GGG3GF79F0GGDG?G<D>F;EG,G?<<CD4>G=>B+C    NH:i:2  HI:i:1  AS:i:94 nM:i:2  Cx:i:8839       Cy:i:7539       UR:Z:120CF
E100026571L1C003R03702347721    0       1       3001778 255     100M    *       0       0       GTATGACATCTGTCCAGGATCTTCTAGCTTTCATAGTCTCTGGTGAGAAGTCTGGAGTAATTCTAATAGGCCTGCATTTATATGTTACTTGACCTTTTTC    EEFEDFFEFFFFEFFFFEC@EFFFFDFFEEFFEFFFFCFCEFFAFBFCED??FGBEFFDC:FFFDCFAF4FAFFDFFDG?DFBD.F@FECA/FEDEFFAA    NH:i:1  HI:i:1  AS:i:92 nM:i:3  Cx:i:12136      Cy:i:14034      UR:Z:C0808      XF:i:2
$ h5dump -n /path/to/output/03.count/SS200000135TL_D1.raw.gef
  HDF5 "/path/to/output/03.count/SS200000135TL_D1.raw.gef" {
  FILE_CONTENTS {
   group      /
   group      /geneExp
   group      /geneExp/bin1
   dataset    /geneExp/bin1/exon
   dataset    /geneExp/bin1/expression
   dataset    /geneExp/bin1/gene
   }
  }

  $ h5dump -d /geneExp/bin1/expression  /path/to/output/03.count/SS200000135TL_D1.raw.gef | head -15
  HDF5 "/path/to/output/03.count/SS200000135TL_D1.raw.gef" {
  DATASET "/geneExp/bin1/expression" {
     DATATYPE  H5T_COMPOUND {
        H5T_STD_U32LE "x";
        H5T_STD_U32LE "y";
        H5T_STD_U8LE "count";
     }
     DATASPACE  SIMPLE { ( 76210618 ) / ( 76210618 ) }
     DATA {
     (0): {
           636,
           12671,
           2
        },
     (1): {

  $ h5dump -d /geneExp/bin1/gene /path/to/output/03.count/SS200000135TL_D1.raw.gef | head -20
  HDF5 "/path/to/output/03.count/SS200000135TL_D1.raw.gef" {
  DATASET "/geneExp/bin1/gene" {
     DATATYPE  H5T_COMPOUND {
        H5T_STRING {
           STRSIZE 32;
           STRPAD H5T_STR_NULLTERM;
           CSET H5T_CSET_ASCII;
           CTYPE H5T_C_S1;
        } "gene";
        H5T_STD_U32LE "offset";
        H5T_STD_U32LE "count";
     }
     DATASPACE  SIMPLE { ( 24670 ) / ( 24670 ) }
     DATA {
     (0): {
           "0610005C13Rik",
           0,
           45
        },
(1): {$ head -8 /path/to/output/03.count/SS200000135TL_D1_raw_barcode_gene_exp.txt x y geneIndex MIDIndex readCount 9602 7705 10551 611723 2 4888 10392 10551 665954 4 8901 7096 10551 881671 1 8901 7096 10551 357383 20 7397 18783 10551 355789 1 9155 13032 10551 297666 1 9155 13032 10551 298690 1
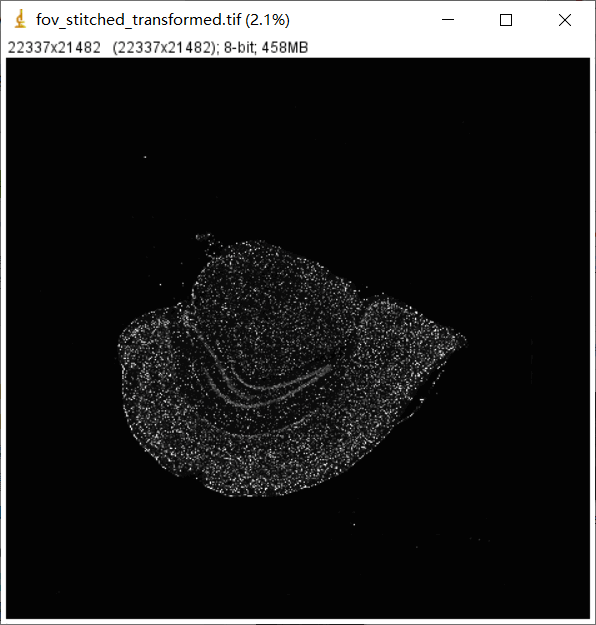
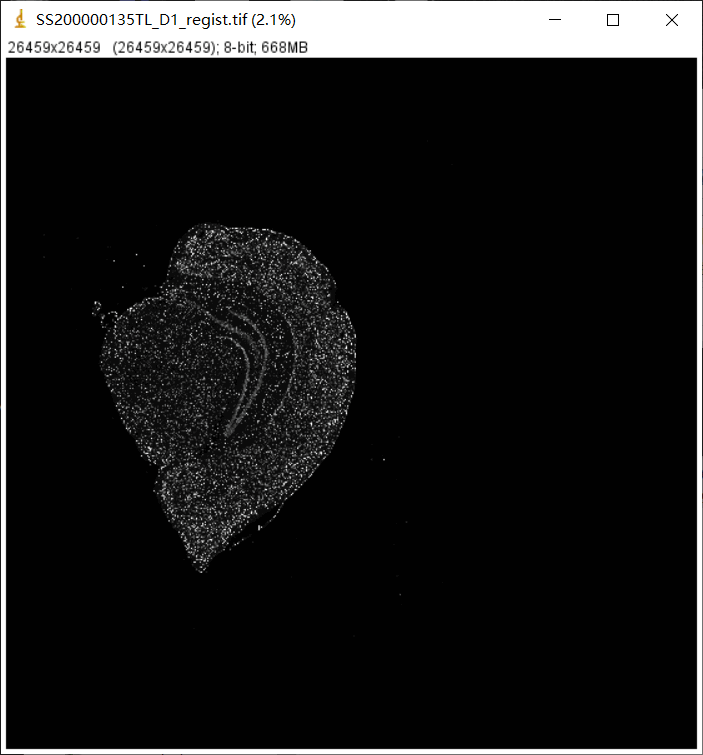
$ h5dump -n /path/to/output/04.register/SS200000135TL_D1_20220527_201353_1.1.0.ipr
HDF5 "/path/to/output/04.register/SS200000135TL_D1_20220527_201353_1.1.0.ipr" {
FILE_CONTENTS {
group      /
group      /ManualState
dataset    /Preview
group      /StereoResepSwitch
group      /ssDNA
group      /ssDNA/CellSeg
dataset    /ssDNA/CellSeg/CellMask
dataset    /ssDNA/CellSeg/CellSegTrace
group      /ssDNA/ImageInfo
dataset    /ssDNA/ImageInfo/RGBScale
group      /ssDNA/QCInfo
group      /ssDNA/QCInfo/CrossPoints
dataset    /ssDNA/QCInfo/CrossPoints/0_0
...
dataset    /ssDNA/QCInfo/CrossPoints/9_8
group      /ssDNA/Register
dataset    /ssDNA/Register/MatrixTemplate
group      /ssDNA/Stitch
group      /ssDNA/Stitch/ScopeStitch
dataset    /ssDNA/Stitch/ScopeStitch/GlobalLoc
dataset    /ssDNA/Stitch/ScopeStitch/ScopeHorizontalJitter
dataset    /ssDNA/Stitch/ScopeStitch/ScopeJitterDiff
dataset    /ssDNA/Stitch/ScopeStitch/ScopeVerticalJitter
group      /ssDNA/Stitch/StitchEval
dataset    /ssDNA/Stitch/StitchEval/GlobalDeviation
dataset    /ssDNA/Stitch/StitchEval/StitchEvalH
dataset    /ssDNA/Stitch/StitchEval/StitchEvalV
dataset    /ssDNA/Stitch/TemplatePoint
dataset    /ssDNA/Stitch/TransformTemplate
group      /ssDNA/TissueSeg
dataset    /ssDNA/TissueSeg/TissueMask
}
}

$ h5dump -A /path/to/output/04.register/SS200000135TL_D1_20220527_201353_1.1.0.ipr | head -20
HDF5 "/path/to/output/04.register/SS200000135TL_D1_20220527_201353_1.1.0.ipr" {
GROUP "/" {
 ATTRIBUTE "IPRVersion" {
    DATATYPE  H5T_STRING {
       STRSIZE H5T_VARIABLE;
       STRPAD H5T_STR_NULLTERM;
       CSET H5T_CSET_UTF8;
       CTYPE H5T_C_S1;
    }
    DATASPACE  SCALAR
    DATA {
    (0): "0.2.0"
    }
 }
 GROUP "ManualState" {
    ATTRIBUTE "calibration" {
       DATATYPE  H5T_ENUM {
          H5T_STD_I8LE;
          "FALSE"            0;
          "TRUE"             1;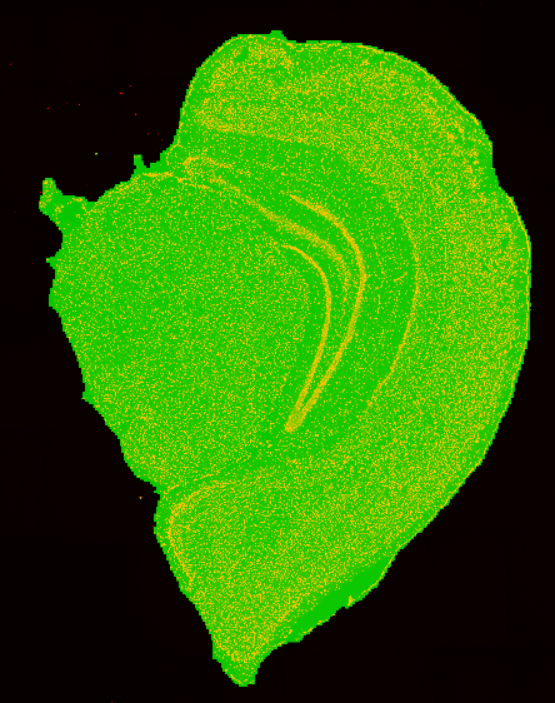
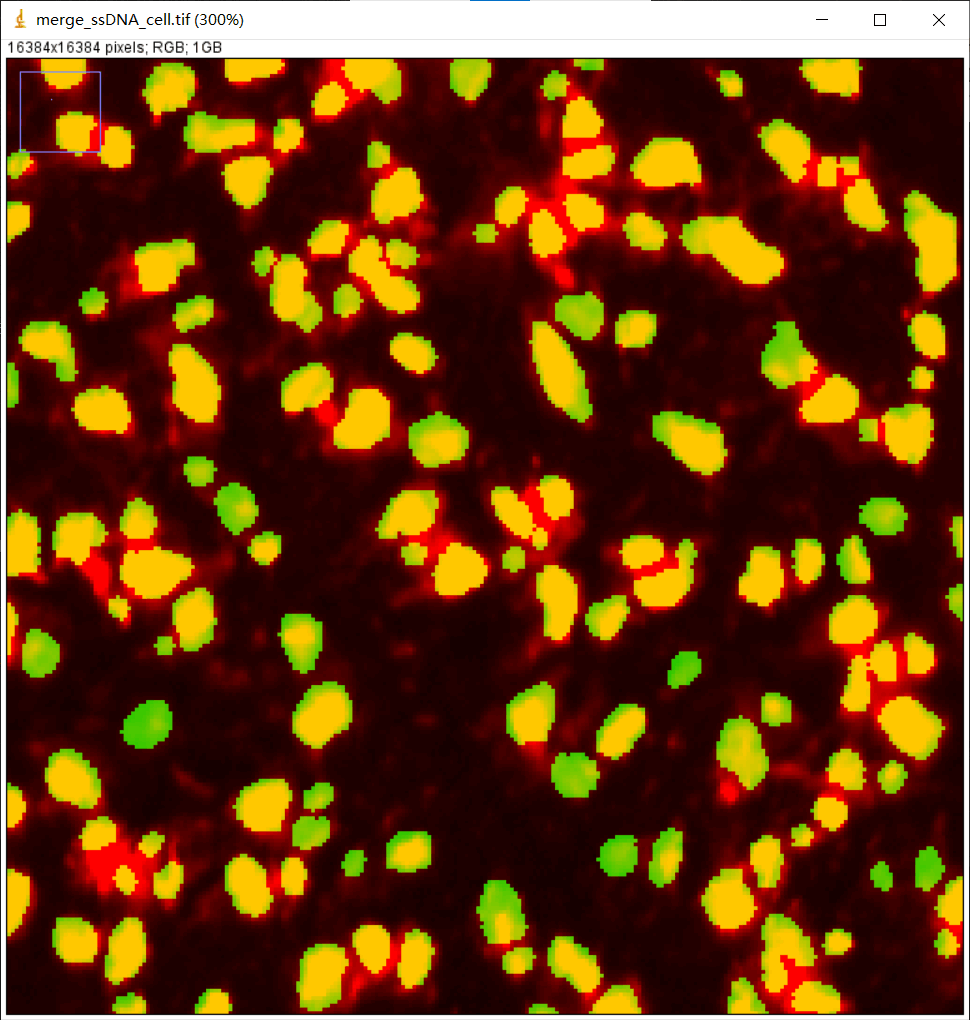

$ cat /path/to/output/05.tissuecut/tissuecut.stat
# Tissue Statistic Analysis with Stain Image
Contour_area: 87086375
Number_of_DNB_under_tissue: 36521212
Ratio: 41.94%Total_gene_type: 24289
MID_counts: 89679129
Fraction_MID_in_spots_under_tissue: 82.76%
Reads_under_tissue: 709807297
Fraction_reads_in_spots_under_tissue: 83.99%

binSize=1
Mean_reads_per_spot: 15.10
Median_reads_per_spot: 9.00
Mean_gene_type_per_spot: 1.71
Median_gene_type_per_spot: 1
Mean_Umi_per_spot: 2.46
Median_Umi_per_spot: 2

binSize=20
Mean_reads_per_spot: 3241.11
Median_reads_per_spot: 2782.00
Mean_gene_type_per_spot: 241.08
Median_gene_type_per_spot: 227
Mean_Umi_per_spot: 409.56
Median_Umi_per_spot: 370

binSize=50
Mean_reads_per_spot: 20054.45
Median_reads_per_spot: 18285.00
Mean_gene_type_per_spot: 1165.56
Median_gene_type_per_spot: 1133
Mean_Umi_per_spot: 2534.10
Median_Umi_per_spot: 2346

binSize=100
Mean_reads_per_spot: 78867.48
Median_reads_per_spot: 72545.00
Mean_gene_type_per_spot: 3110.83
Median_gene_type_per_spot: 3117
Mean_Umi_per_spot: 9964.35
Median_Umi_per_spot: 9205

binSize=150
Mean_reads_per_spot: 174614.34
Median_reads_per_spot: 162073.00
Mean_gene_type_per_spot: 4926.51
Median_gene_type_per_spot: 5065
Mean_Umi_per_spot: 22066.71
Median_Umi_per_spot: 20430

binSize=200
Mean_reads_per_spot: 305687.91
Median_reads_per_spot: 285723.00
Mean_gene_type_per_spot: 6424.38
Median_gene_type_per_spot: 6747
Mean_Umi_per_spot: 38621.50
Median_Umi_per_spot: 36060
$ h5dump -n /path/to/output/05.tissuecut/SS200000135TL_D1.tissue.gef
  HDF5 "/path/to/output/05.tissuecut/SS200000135TL_D1.tissue.gef" {
  FILE_CONTENTS {
   group      /
   group      /geneExp
   group      /geneExp/bin1
   dataset    /geneExp/bin1/exon
   dataset    /geneExp/bin1/expression
   dataset    /geneExp/bin1/gene
   }
  }

  $ h5dump -d /geneExp/bin1/expression /path/to/output/05.tissuecut/SS200000135TL_D1.tissue.gef | head -15
  HDF5 "/path/to/output/05.tissuecut/SS200000135TL_D1.tissue.gef" {
  DATASET "/geneExp/bin1/expression" {
     DATATYPE  H5T_COMPOUND {
        H5T_STD_U32LE "x";
        H5T_STD_U32LE "y";
        H5T_STD_U8LE "count";
     }
     DATASPACE  SIMPLE { ( 62542665 ) / ( 62542665 ) }
     DATA {
     (0): {
           6148,
           10906,
           1
        },
     (1): {

  h5dump -d /geneExp/bin1/gene /path/to/output/05.tissuecut/SS200000135TL_D1.tissue.gef | head -20
  HDF5 "/path/to/output/05.tissuecut/SS200000135TL_D1.tissue.gef" {
  DATASET "/geneExp/bin1/gene" {
     DATATYPE  H5T_COMPOUND {
        H5T_STRING {
           STRSIZE 64;
           STRPAD H5T_STR_NULLPAD;
           CSET H5T_CSET_ASCII;
           CTYPE H5T_C_S1;
        } "gene";
        H5T_STD_U32LE "offset";
        H5T_STD_U32LE "count";
     }
     DATASPACE  SIMPLE { ( 24289 ) / ( 24289 ) }
     DATA {
     (0): {
           "0610005C13Rik",
           0,
           24
        },
(1): {$ h5dump -n /path/to/output/03.count/SS200000135TL_D1.gef
HDF5 "/path/to/output/03.count/SS200000135TL_D1.gef" {
FILE_CONTENTS {
group /
group /geneExp
group /geneExp/bin1
dataset /geneExp/bin1/exon
dataset /geneExp/bin1/expression
dataset /geneExp/bin1/gene
group /geneExp/bin10
dataset /geneExp/bin10/exon
dataset /geneExp/bin10/expression
dataset /geneExp/bin10/gene
group /geneExp/bin100
dataset /geneExp/bin100/exon
dataset /geneExp/bin100/expression
dataset /geneExp/bin100/gene
group /geneExp/bin20
dataset /geneExp/bin20/exon
dataset /geneExp/bin20/expression
dataset /geneExp/bin20/gene
group /geneExp/bin200
dataset /geneExp/bin200/exon
dataset /geneExp/bin200/expression
dataset /geneExp/bin200/gene
group /geneExp/bin50
dataset /geneExp/bin50/exon
dataset /geneExp/bin50/expression
dataset /geneExp/bin50/gene
group /geneExp/bin500
dataset /geneExp/bin500/exon
dataset /geneExp/bin500/expression
dataset /geneExp/bin500/gene
group /stat
dataset /stat/gene
group /wholeExp
dataset /wholeExp/bin1
dataset /wholeExp/bin10
dataset /wholeExp/bin100
dataset /wholeExp/bin20
dataset /wholeExp/bin200
dataset /wholeExp/bin50
dataset /wholeExp/bin500
group /wholeExpExon
dataset /wholeExpExon/bin1
dataset /wholeExpExon/bin10
dataset /wholeExpExon/bin100
dataset /wholeExpExon/bin20
dataset /wholeExpExon/bin200
dataset /wholeExpExon/bin50
dataset /wholeExpExon/bin500
}
}
$ h5dump -d /stat/gene /path/to/output/03.count/SS200000135TL_D1.gef | head -20
HDF5 "/path/to/output/03.count/SS200000135TL_D1.gef" {
DATASET "/stat/gene" {
DATATYPE H5T_COMPOUND {
H5T_STRING {
STRSIZE 64;
STRPAD H5T_STR_NULLTERM;
CSET H5T_CSET_ASCII;
CTYPE H5T_C_S1;
} "gene";
H5T_STD_U32LE "MIDcount";
H5T_IEEE_F32LE "E10";
}
DATASPACE SIMPLE { ( 24670 ) / ( 24670 ) }
DATA {
(0): {
"Gm42418",
5860952,
60.1028
},
(1): {$ h5dump -n /path/to/output/051.cellcut/SS200000135TL_D1.cellbin.gef
HDF5 "/path/to/output/051.cellcut/SS200000135TL_D1.cellbin.gef" {
FILE_CONTENTS {
group /
group /cellBin
dataset /cellBin/blockIndex
dataset /cellBin/blockSize
dataset /cellBin/cell
dataset /cellBin/cellBorder
dataset /cellBin/cellExon
dataset /cellBin/cellExp
dataset /cellBin/cellExpExon
dataset /cellBin/cellTypeList
dataset /cellBin/gene
dataset /cellBin/geneExon
dataset /cellBin/geneExp
dataset /cellBin/geneExpExon
}
}$ cat /path/to/output/07.saturation/sequence_saturation.tsv sample bar_x bar_y1 bar_y2 bar_umi bin_x bin_y1 bin_y2 bin_umi 0.05 26687198 0.250475 1 20002730 26687198 0.273744 3030 7041 0.1 53374396 0.389862 1 32565765 53374396 0.409615 4045 11464 0.2 106748792 0.542456 1 48842313 106748792 0.557064 4962 17194 0.3 160123200 0.625182 1 60017028 160123200 0.636707 5435 21128 0.4 213497584 0.677501 1 68852648 213497584 0.6871 5778 24238 0.5 266871984 0.713814 1 76374913 266871984 0.722081 6052 26886 0.6 320246400 0.740741 1 83026752 320246400 0.748035 6234 29228 0.7 373620768 0.761599 1 89071589 373620768 0.768155 6381 31356 0.8 426995168 0.778242 1 94689701 426995168 0.784222 6528 33334 0.9 480369568 0.79188 1 99974373 480369568 0.797395 6639 35194 1 533743961 0.803326 1 104973406 533743961 0.808462 6718 36641
$ head /path/to/output/08.report/SS200000135TL_D1.statistics.json
{
  "version": "version_v2",
  "1.Filter_and_Map": {
      "1.1.Adapter_Filter": [
        {
              "Sample_id": "E100026571_L01_trim_read_1",
              "getCIDPositionMap_uniqCIDTypes": "645784920",
              "total_reads": "1002214171",
              "CID_withN_reads": "8031        (0.00  %)",
              "mapped_reads": "845113606   (84.32 %)",
