Introduction
Spatial transcriptomics has transformed our understanding of gene expression by linking molecular activity to precise anatomical contexts. Stereo-seq stands out with its unparalleled single-cell resolution, large-scale chip capacity, and cross-species compatibility, providing robust support for high-throughput spatial data analysis across diverse tissue types and research applications. Among its key applications, spatial gene co-expression analysis has emerged as a novel powerful tool to dissect functional gene sets that operate within localized biological regions. This approach bridges the gap between traditional gene co-expression studies and the spatial resolution required to study complex tissues. In this blog, we explore the principles of spatial gene co-expression, evaluate the performance of computational algorithms on Stereo-seq datasets, and highlight case studies demonstrating its translational potential.
What is Spatial Gene Co-expression?
Spatial gene co-expression extends classical co-expression analysis (e.g., Weighted Gene Co-expression Network Analysis, WGCNA) by integrating spatial coordinates. While traditional methods identify genes that co-vary in expression across samples, spatial co-expression specifically identifies modules of genes that both co-vary in expression and localize to specific regions (Figure 1). This spatial dimension is critical for studying systems where gene function depends on microenvironmental contexts, such as tumors, neural circuits, and developing organs.

Figure 1. Spatial Gene Co-expression workflow. Algorithms primarily build correlations between genes based on gene expression and spatial location data to understand gene interaction networks and identify highly co-varying gene modules.
Selected Algorithms for Spatial Gene Co-expression Analysis
We selected three spatial gene co-expression algorithms—NeST1, Hotspot2, and hdWGCNA3—for their robust integration of spatial information and compatibility with high-resolution datasets. These methods do not rely on cell-type annotations, ensuring unbiased analysis, and preserving data integrity by avoiding imputation of missing expression values.
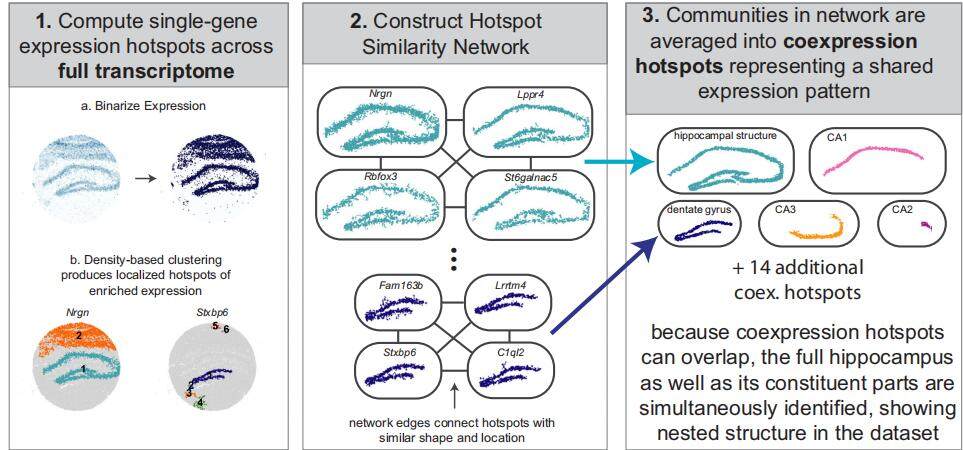
1. NeST Principle (Figure 2):
Density Clustering: Applies DBSCAN-like algorithms to group neighboring spots and identify spatially variable genes.
Graph-Based Clustering: Compares gene expression similarity across spatially variable genes to construct co-expression modules.
Strength: Utilize spatial distance information to distinguish fine anatomical structures under high resolution.

Figure 2. Schematic representation of the NeST Algorithm 1.
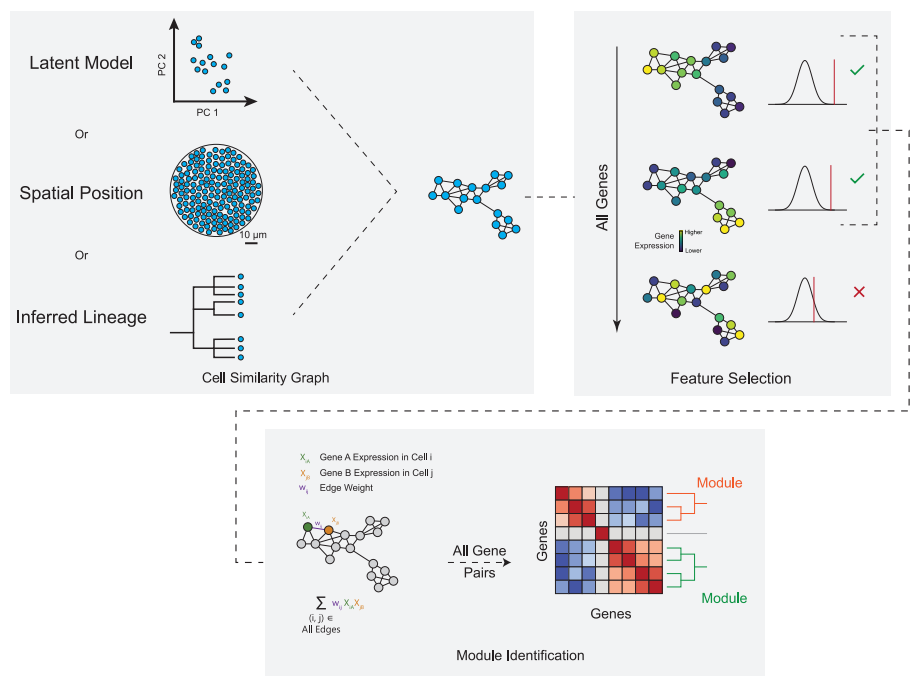
2. Hotspot Principle (Figure 3):
KNN-Based Graph Construction: Builds a cell similarity graph using spatial coordinates or lineage information.
Statistical Testing: Identifies spatially variable genes by comparing each gene’s expression to its similarity graph(local neighborhood)
Hierarchical Clustering: Groups spatially co-expressed genes into modules based on pairwise similarity.
Strength: Statistical rigor and ease of interpretation via corrected P-values.

Figure 3. Schematic representation of the Hotspot Algorithm 2.
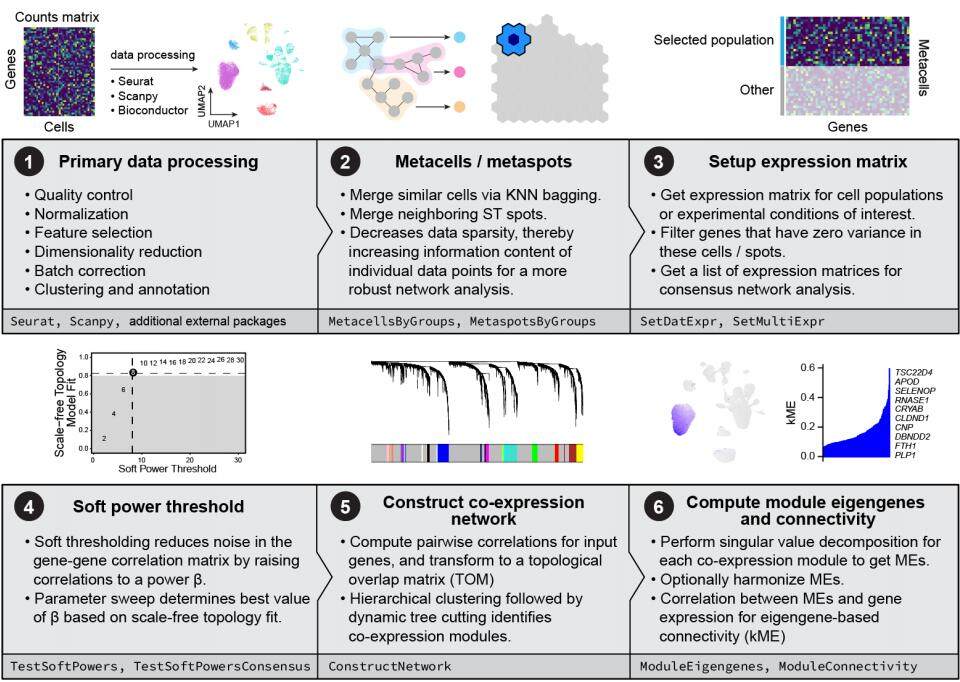
3. hdWGCNA Principle (Figure 4):
Meta-Cell Aggregation: Uses KNN to cluster similar cells into "meta-cells" based on gene expression.
Weighted Adjacency Matrix: Computes gene-gene co-expression weights across meta-cells.
Hierarchical Clustering: Applies WGCNA to identify co-expression modules and interpret functional roles.
Strength: Robust network analysis and compatibility with both spatial and single-cell data.

Figure 4. Schematic representation of the hdWGCNA Algorithm 3.
Algorithm Performance on Stereo-seq Data
1. Tested Stereo-seq Data
We tested a total of 11 samples, including mouse brain and various human tumor samples. For each sample, we tested cellbin, bin20, bin50, and bin100, if available. The gene count of bin20 data ranges from approximately 100 to about 900, indicating a wide coverage of data quantity (Table 1).
Table 1. Gene Count of various bin size in tested Stereo-seq data.
2. Evaluation scheme
We evaluated NeST, Hotspot, and HDWGCNA under identical computational conditions, restricting each to 8 CPU cores for parallel processing. Default parameters from official tutorials were retained across algorithms, with spatial distance-related settings adjusted to match our dataset's bin size resolution. Performance assessment involved four key dimensions spanning eight quantitative metrics (Table 2).
Table 2. Evaluation scheme. Mainly focused on four aspects involving 8 metrics, referenced from related algorithm articles and public databases.
3. Evaluation results
3.1 Summary
We recommend selecting the appropriate algorithm based on specific samples and making personalized parameter adjustments (Table 3). The performance evaluation of the three spatial co-expression algorithms aligns with their underlying principles. Generally, if you want to get the results fast, try hdWGCNA and NeST first. hdWGCNA shows higher consistency in gene function and NeST shows more accurate spatial pattern recognition. Try Hotspot if the data matrix is too sparse.
Table 3. Evaluation results. Recommendation levels are indicated by star ratings, with three stars showing the highest level of recommendation.
3.2 Detailed evaluation results
Result magnitude
Regarding the magnitude of spatial gene co-expression results(Figure 5), the Hotspot algorithm demonstrated superior performance in identifying a higher number of spatially variable genes and co-expressed modules compared to NeST and hdWGCNA. Specifically, hdWGCNA exhibited a distinct pattern by forming fewer gene modules (8–12 modules) but with significantly larger sizes (300–600 genes per module).

Figure 5. Result magnitude of different algorithms. Number of spatial highly variable genes (Left), Number of co-expressed gene modules (Middle), Number of genes per co-expressed gene module (Right)
Spatial autocorrelaiton
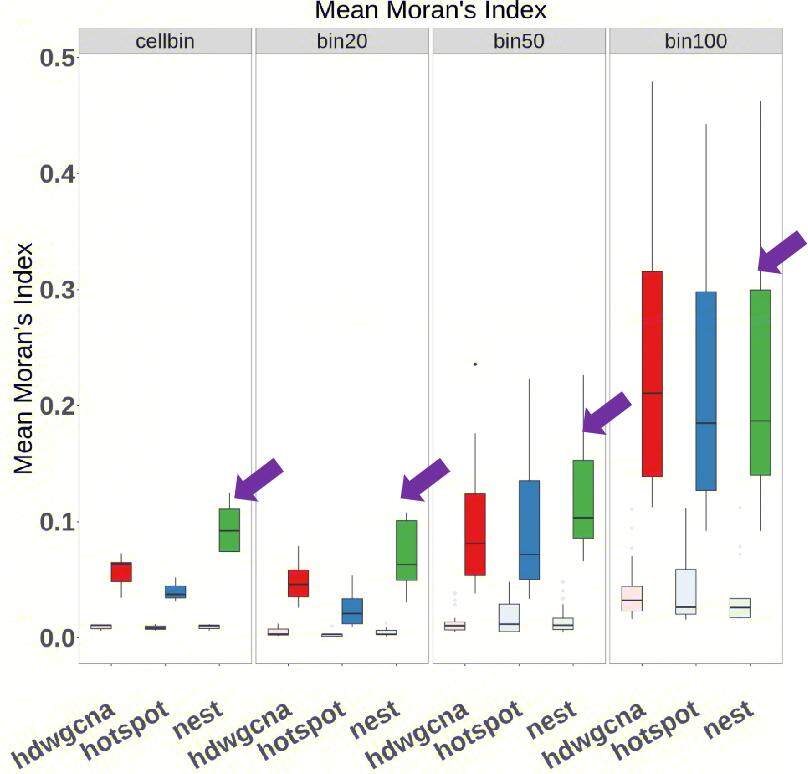
Regarding the spatial autocorrelation detection (Figure 6), our analysis demonstrates that the NeST algorithm significantly outperforms Hotspot and hdWGCNA in enriching spatially coherent gene patterns in cellbin and bin20 datasets. However, as spatial resolution decreases, the performance advantage of NeST gradually diminishes, likely due to reduced gene loss that blurs distinctions between algorithms.

Figure 6. Spatial autocorrelaiton of different algorithms. Mean Moran's index was calculated to evaluate spatial autocorrelaiton. We randomly selected the same number of spatial high-variability genes and co-expression gene sets as a baseline (light color boxes) for a more intuitive comparison of results.
Co-expressed gene modules accuracy
In terms of co-expressed gene module accuracy (Figure 7), our evaluation demonstrated that hdWGCNA achieved superior performance compared to NeST and Hotspot, as evidenced by both higher functional coherence of gene modules and greater detection sensitivity for known co-expressed gene pairs.

Figure 7. Co-expressed gene modules accuracy of different algorithms. Biological function consistency of the same gene module (EGAD AUC Left). Detection rate of co-expressed gene pairs in public databases (Right)
Runtime and Memory
Regarding runtime and memory analysis, they are directly related to the number of cells and genes: the more cells and genes, the longer the time required and the greater the memory demand. The Hotspot algorithm exhibited the longest runtime, while cellbin and bin20 required significantly longer processing times (exceeding 24 hours) due to large dataset sizes but had the lowest memory demands. In contrast, hdWGCNA and NeST demonstrated relatively faster performance, completing in 1–2 hours for bin50/bin100 datasets and 3–5 hours for cellbin/bin20 datasets.

Figure 8. Runtime and memory usage of different algorithms.
Case Studies: Translating Spatial Co-expression into Biological Insights
Case Study 1: Tumor subtype Identification
We aimed to reproduce findings from a Nature Genetics article that identified tumor cell subpopulations (MP6/MP7) using scRNA-Seq data and demonstrated their spatial distribution with Stereo-seq data4. The goal was to achieve similar results solely through spatial transcriptomics and gene co-expression algorithms, without relying on scRNA-Seq data. All three algorithms demonstrated the feasibility of spatial transcriptomics alone for tumor subtype spatial mapping, offering a cost-effective alternative to single-cell approaches while enabling deeper gene module exploration (Figure 9).

Figure 9. Comparison between the results obtained from the Hotspot Algorithm and the figures presented in the article 4.
Case Study 2: lncRNA and mRNA Co-expression
We explored the co-expression patterns between lncRNA (MALAT1) and mRNA (PTPN13) in lung tumor samples using Stereo-seq OMNI and the NeST algorithm(Figure 10). The identified co-expression region were validated via cell annotations and clustering results, suggesting potential regulatory roles in tumor biology.
 and mRNA (PTPN13), validated by cell annotation, cluster, and HE statinng.jpg)
Figure 10. Co-expression pattern between lncRNA (MALAT1) and mRNA (PTPN13), validated by cell annotation, cluster, and HE statinng.
Case Study 3: Host and Microbial Co-expression
Our Stereo-seq OMNI platform captures RNAs from both host and microbes, enabling joint analysis of host-microbe interactions. Using a four-week Mycobacterium tuberculosis-infected mouse lung model, we identified 97 host genes strongly co-expressed with tuberculosis pathogens by applying the Hotspot algorithm (Figure 11). KEGG pathway analysis revealed enriched immune activity in these genes at specific tissue locations. Notably, macrophage-mediated immune responses correlated with bacterial infection, consistent with existing immunological findings.

Figure 11. Co-expression pattern between host genes and Mycobacterium tuberculosis.
Key Takeaways:
Spatial gene co-expression analysis, powered by platforms like Stereo-seq, is reshaping our understanding of gene function in complex biological systems. By integrating spatial context with transcriptomic data, researchers can explore spatial gene co-expression analysis using Stereo-seq data, emphasizing its utility in the detection and interpretation of biogical regions (e.g., tumor subtyping, lncRNA-mRNA co-expression, host-microbe co-expression). We have evaluated three algorithms on Stereo-seq datasets, highlighting their unique strengths:
hdWGCNA: Fast and shows higher consistency in gene function
NeST: Fast and High-resolution spatial pattern detection for fine anatomical structures.
Hotspot: Optimal for sparse datasets with its statistical rigor
We also provided some suggestion for your parameter adjustments:
hdWGCNA: Reduce the soft_power parameter to increase the number of identified co-expression modules. A lower soft_power value enhances network connectivity, allowing for the detection of weaker but biologically meaningful correlations.
NeST: Decrease the hotspot_min_size, hotspot_min_samples, or min_cells parameters. Lowering these thresholds allows the detection of smaller or less abundant co-expression modules that might otherwise be filtered out.
Hotspot: Adjust the fdr_cutoff from 0.01 to 0.05 to relax the statistical stringency, thereby increasing the number of identified modules. Switch the model parameter to Bernoulli, which is better suited for binary or sparse expression data.
References:
1. Walker, B. L., & Nie, Q. (2023). NeST: nested hierarchical structure identification in spatial transcriptomic data. Nature communications, 14(1), 6554.
2. DeTomaso, D., & Yosef, N. (2021). Hotspot identifies informative gene modules across modalities of single-cell genomics. Cell systems, 12(5), 446-456.
3. Morabito, S., Reese, F., Rahimzadeh, N., Miyoshi, E., & Swarup, V. (2023). hdWGCNA identifies co-expression networks in high-dimensional transcriptomics data. Cell reports methods, 3(6).
4. Fan, J., Lu, F., Qin, T., Peng, W., Zhuang, X., Li, Y., ... & Sun, C. (2023). Multiomic analysis of cervical squamous cell carcinoma identifies cellular ecosystems with biological and clinical relevance. Nature genetics, 55(12), 2175-2188.
5. Obayashi et al. (2023) COXPRESdb v8: an animal gene coexpression database navigating from a global view to detailed investigations. Nucleic Acids Research, 51: D80-D87.
Stay tuned for future blogs exploring cutting-edge applications of spatial omics in single-cell and multi-omics integration!
About STOmics: STOmics is a global leader in spatial omics technology, offering cutting-edge platforms like Stereo-seq to empower researchers in academia and industry. For more information, visit https://en.stomics.tech/.
Author:
![]() Gaotong Liu, the Assistant Research Fellow in Bioinformatics at STOmics Tech
Gaotong Liu, the Assistant Research Fellow in Bioinformatics at STOmics Tech
