
Learn how to utilize multi-modal staining images (nucleus, cytoplasm, and membrane) for accurate cell segmentation. This guide will help you generate a precise CellBin matrix for Stereo-seq data, unlocking spatial transcriptomics analysis at true single-cell resolution.
Why Cell Boundaries Make or Break Your Downstream Spatial Biology
When processing high-resolution spatial omics data, we consistently face a critical question: How do we accurately define the boundary of a cell?
In the standard Stereo-seq analysis pipeline, the most common approach is "Nucleus Expansion". This approach operates much like pressing a cookie cutter into a complex tissue canvas—it first locates the cell nucleus and then uniformly expands outward by a fixed distance (e.g., 10 bins).
While this geometric processing is simple and computationally efficient, it often comes at the cost of authentic biological detail:
Morphological Distortion: Real-world cells are not perfect circles. They can be elongated neurons, flattened endothelial cells, or highly irregular immune cells. The expansion method inevitably smooths over these distinct morphological features.
Signal Crosstalk (Leakage): In dense tissue regions, this uniform geometric expansion can easily misallocate mRNA transcripts belonging to Cell A to its neighbor, Cell B, generating background noise and false signals.
Loss of Spatial Polarity: Many critical biological processes occur near the cell membrane. Without accurate physical boundaries, we lose the ability to observe the true subcellular spatial distribution and polarity of mRNA within the cytoplasm.
Ultimately, accurate cell boundaries establish a reliable foundation for all downstream analyses, including clustering, cell-type annotation, and spatial cell-cell communication.
By introducing multi-modal imaging (nucleus, cytoplasm, and membrane), we can define cellular territories using actual biological boundaries. Instead of guessing or inferring where a cell ends, we let the image data tell us exactly where the physical borders lie. This "What You See Is What You Get" segmentation approach ensures that every single molecule is accurately assigned to its rightful cellular home, ultimately yielding a far more biologically meaningful CellBin matrix.
What You'll Be Able to Do
Replace geometric expansion with true biological boundaries to restore authentic cellular morphology and polarity.
Run an end-to-end Nucleus + Cytoplasm + Membrane deep-learning segmentation to output high-fidelity Cell Masks.
Replace the masks within StereoMap and route them back into the SAW
realignpipeline to regenerate the CellBin matrix.Visualize and inspect the updated spatial cell data within StereoMap.
Whether you require GPU-accelerated computing for high-efficiency processing or a lightweight CPU environment for channel-by-channel adjustment, this guide provides a tailored pipeline to match your infrastructure.
Prerequisites
Before getting started, please ensure you have the following software tools and files prepared.
Software Tools
Sample Data Download
This tutorial uses a mouse liver tissue dataset for demonstration. You can download the dataset to follow along with the hands-on practice.
Product Solution: Spatial Transcriptomics FFPE V1.1
Staining Panel: Multi-modal Staining (Nucleus, Cytoplasm, and Membrane)
Chip SN: Y40179K2
Multi-modal Cell Segmentation to Generate Mask
Depending on your computational resources and the initial state of your data, please choose the path that best suits your workflow:
Scenario 1: End-to-End Multimodal Segmentation (GPU Accelerated)
This workflow integrates Nucleus, Cytoplasm, and Membrane signals to define precise cell boundaries using a deep-learning model.
Ensure that cellbin2is successfully installed in your Conda environment. Then, check your cellposeversion in the terminal to confirm it is 4.x.x:
python -c "import cellpose; print(cellpose.version)"
If the version does not match, please uninstall the current version first:
pip uninstall -y cellpose
Then, install the latest cellpose-4.x.x release:
pip install cellpose --upgrade
Now we enter the analysis steps. Copy or download script below as cellposesam.py. This script supports automatic stacking of single-channel images or direct input of multi-channel color images.
Script Download: cellposesam.py
Since the model weight is large (approx. 1.2GB), please execute the following commands in the server terminal to download it in advance:
mkdir -p ./cellpose_models
wget -P ./cellpose_models https://github.com/STOmics/cellbin2/releases/download/weights-v1.0.0/cpsam
Mode A: Single-channel Images Input (Recommended)
Suitable for the registered single-channel images output by saw count. When all three channels are present, the cellposesam.pyscript automatically merges them into an RGB image for model inference following this logic: Nucleus→Blue, Cytoplasm→Green, Membrane→Red.
To accommodate diverse experimental staining panels, the script supports smart adaptation for two-channel data. If either the cytoplasm or membrane channel is missing, the script will automatically duplicate the available signals in the background to fulfill the model's 3-channel input requirement:
Nucleus + Cytoplasm Scenario: Input only
--nucand--cyto. The script automatically maps the Cytoplasm signal to the missing Membrane channel.Nucleus + Membrane Scenario: Input only
--nucand--mem. The script automatically maps the Membrane signal to the missing Cytoplasm channel.
# Estimated time: 1.5 - 2 hours (20k x 20k pixels)

python cellposesam.py \
    --nuc ./Y40179K2/outs/image/Y40179K2_DAPI_regist.tif \
    --cyto ./Y40179K2/outs/image/Y40179K2_CY5_IF_regist.tif \
    --mem ./Y40179K2/outs/image/Y40179K2_TRITC_IF_regist.tif \
    -o ./single_channel_cpsam_seg \
    -m ./cellpose_models/cpsam \
    -g 1
Mode B: Multi-channel Image Input
For pre-merged color registered images.
# Estimated time: 1.2 - 1.5 hours (20k x 20k pixels)

python cellposesam.py \
    -i ./Y40179K2_merged_RGB.tif \
    -o ./multi_channel_cpsam_seg \
    -m ./cellpose_models/cpsam \
    -g 1
Tips
Highly Recommended Input (for 16-bit images): Prioritize [Mode A]
When pre-merging multi-channel images in third-party software (e.g., ImageJ), a visual histogram stretch (LUT) is automatically applied to optimize for human viewing. This compression permanently destroys weak cellular boundary signals. [Mode A] directly reads the underlying raw physical data for lossless merging, ensuring the highest possible segmentation accuracy.
(Note: If your raw images are natively 8-bit directly from the device, this compression loss does not occur, and you may safely use [Mode B].)
The script will automatically create the output directory. Ensure you have write permissions for the parent directory.
Upon completion, the *_cpsam_mask_watershed.tiffile will be generated in the -odirectory. Please download this file to your local machine. It will be used to replace the default cell mask in StereoMap.
Scenario 2: Step-by-Step Channel Segmentation (CPU Compatible)
Use this scenario if your computing environment is not equipped with an NVIDIA GPU, or if you need to apply distinct segmentation strategies for the DAPI (Nucleus), CY5 (Cytoplasm), and TRITC (Membrane) channels. This solution is divided into two stages: Inference (Segmentation) and Logical Fusion.
Phase 1: Independent Segmentation
In this phase, we generate raw mask images for each staining channel using the most suitable algorithm engine for that specific signal.
Nuclei Segmentation
# Estimated time: 1 hour (20k x 20k pixels)

python cell_segmentor.py \
   -i ./Y40179K2/outs/image/Y40179K2_DAPI_regist.tif \
   -o ./cell_seg_masks \
   -p ./cellseg_weights \
   -s dapi \
-g -1Script Download: cell_segmentor.py
Uses the built-in CellBin2 model to process the DAPI channel and locate cell cores.
Algorithm Engine: BCDU / UNet (CellBin2 Built-in)
Cytoplasm & Membrane Segmentation
Script Download: cellpose_segmentor.py
Uses the Cellpose engine to extract cytoplasm and membrane contours respectively.
Algorithm Engine: Cellpose (Model: cyto2)
# Estimated time: 1 hour for each image (20k x 20k pixels)

python cellpose_segmentor.py \
    -i ./Y40179K2/outs/image/Y40179K2_CY5_IF_regist.tif \
    -o ./cell_seg_masks \
    -m ./cellseg_weights \
    -n cyto2 \
    -g -1

python cellpose_segmentor.py \
    -i ./Y40179K2/outs/image/Y40179K2_TRITC_IF_regist.tif \
    -o ./cell_seg_masks \
    -m ./cellseg_weights \
    -n cyto2 \
    -g -1
Phase 2: Multi-modal Contour Integration & Selection
In this stage, the script evaluates candidate contours from all modalities (nucleus, cytoplasm, and membrane) for each individual cell. It strategically selects the most biologically accurate boundary source for every cell to construct a high-fidelity Cell Mask.
To accommodate diverse staining panels, the script supports adaptive dual-channel fusion: the Nucleus Mask is strictly required, but if either the cytoplasm or membrane mask is missing, simply input the available parameters and the script will automatically switch to the corresponding fusion strategy.
Please copy or download the following script as multimodal_cell_merge.py.
Script Download: multimodal_cell_merge.py
Next, run the fusion command.
# Estimated time: 0.5 hours

python multimodal_cell_merge.py \
    --nuc ./cell_seg_masks/Y40179K2_DAPI_regist_v3_mask.tif \
    --cyto ./cell_seg_masks/Y40179K2_CY5_IF_regist_cellpose_mask.tif \
    --mem ./cell_seg_masks/Y40179K2_TRITC_IF_regist_cellpose_mask.tif \
    -o ./cell_seg_masks \
    -d 10
Upon successful execution, you will find the generated final_cell_mask.tiffile in the ./cell_seg_masksdirectory. Download this file to your local machine. It will be used to import into the StereoMap software to replace the original segmentation masks for downstream analysis.
Scenario 3: Direct Fusion of Pre-existing Masks
This scenario is designed for users who already have separate mask files (e.g., exported from third-party software or generated from custom-trained models) for Nuclei, Cytoplasm, and Membrane, and simply need to integrate them into a unified single-cell mask.
Please ensure that the multimodal_cell_merge.py script provided in Scenario 2 is saved in your working directory. Call the script directly to perform a logical merge of your existing masks:
# Estimated time: 0.5 hours

python multimodal_cell_merge.py \
    --nuc ./your_masks/existing_nuclei_mask.tif \
    --cyto ./your_masks/existing_cytoplasm_mask.tif \
    --mem ./your_masks/existing_membrane_mask.tif \
    -o ./cell_seg_masks \
    -d 10
Important Note:
Coordinate Alignment: The fusion script performs strictly logical mask merging, not image registration. Please ensure that all input masks are aligned to the same coordinate system prior to execution.
Import Multi-modal Cell Segmentation Mask
Once the multi-modal mask is successfully generated, the next step is to import it into StereoMap for spatial visualization and matrix recalculation.
Open StereoMap and navigate to the Image Processing module. From the Image Type dropdown menu, select the DAPI+mIF (Nuclei-staining image + immunofluorescence image) option.
Select the appropriate file format based on how your upstream pipeline was executed:
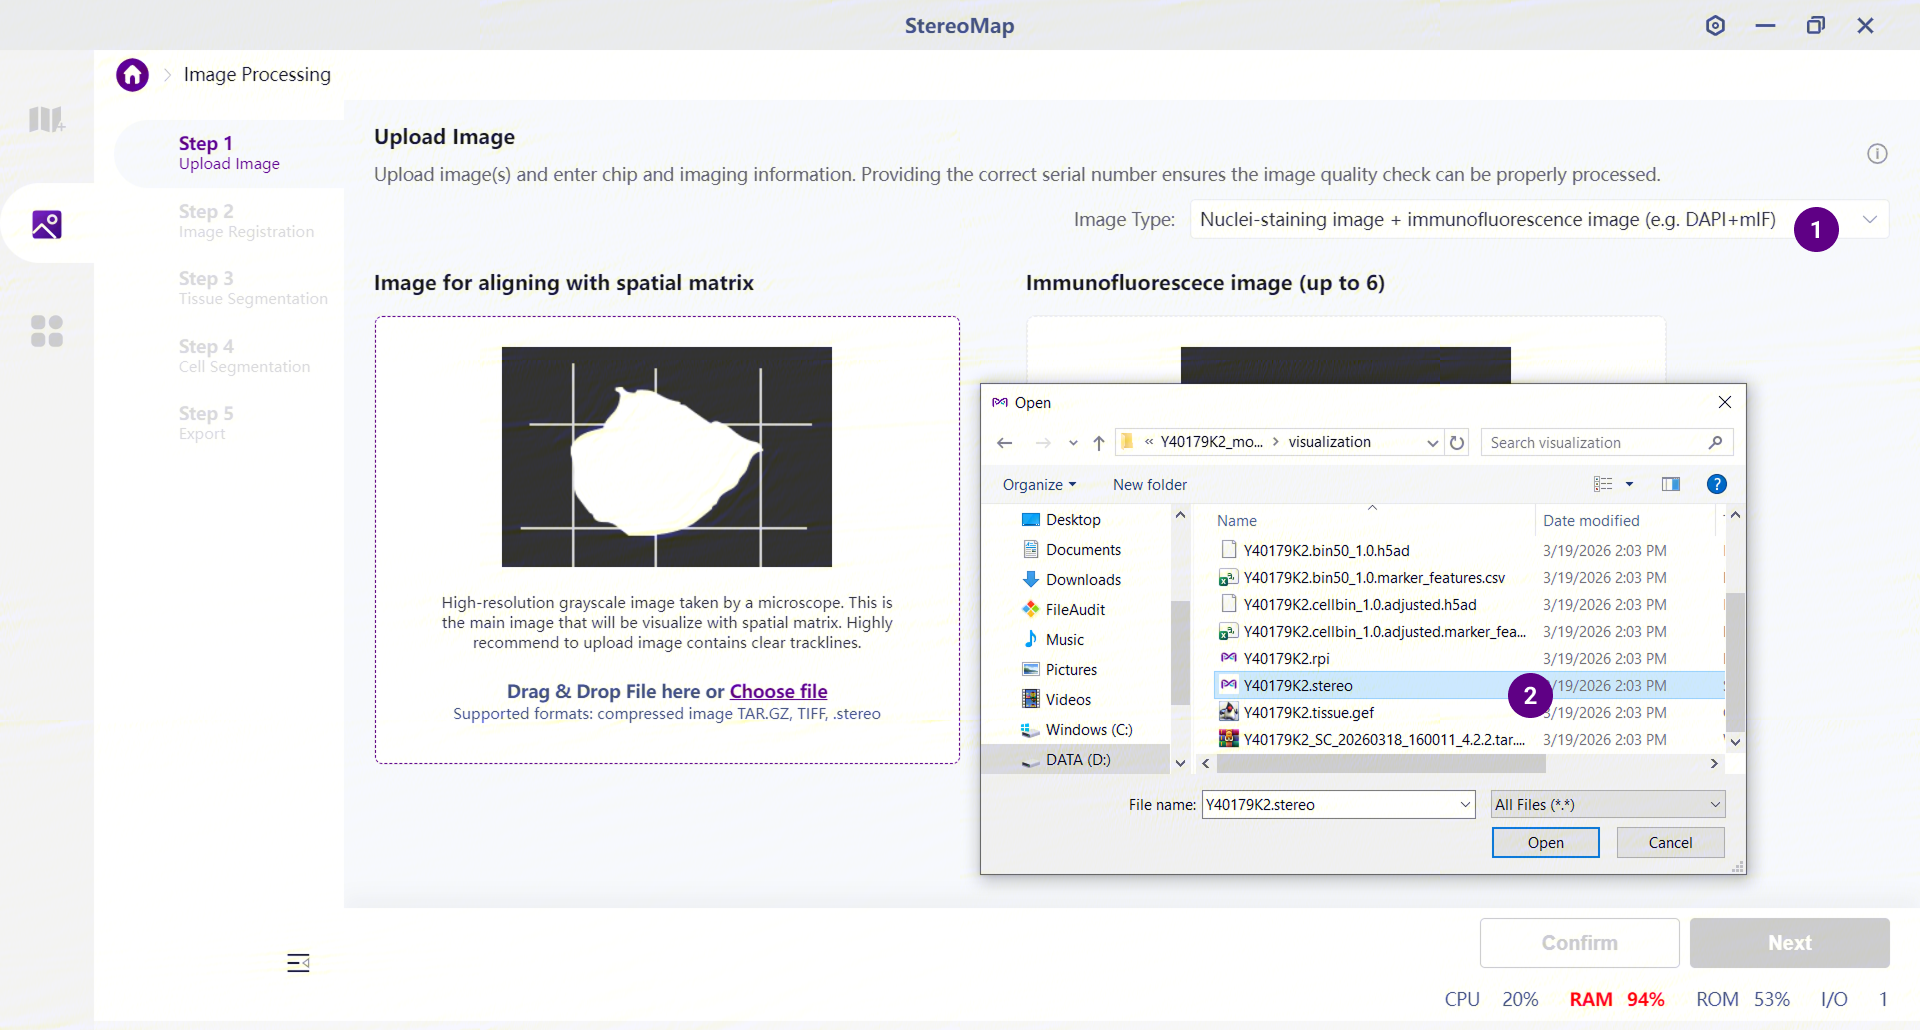
Recommended: Upload
.stereofile. If automated image analysis was successfully enabled and completed during the SAW run, upload this file directly (it already contains the necessary registration matrix).Alternative: Upload
.tar.gzpackage. If the image failed the upstream QC stage, or if no image was used during the SAW analysis, please upload the raw image package instead.If a
.stereofile is uploaded and registration looks correct, simply click Next in Step 2: Image Registration to proceed.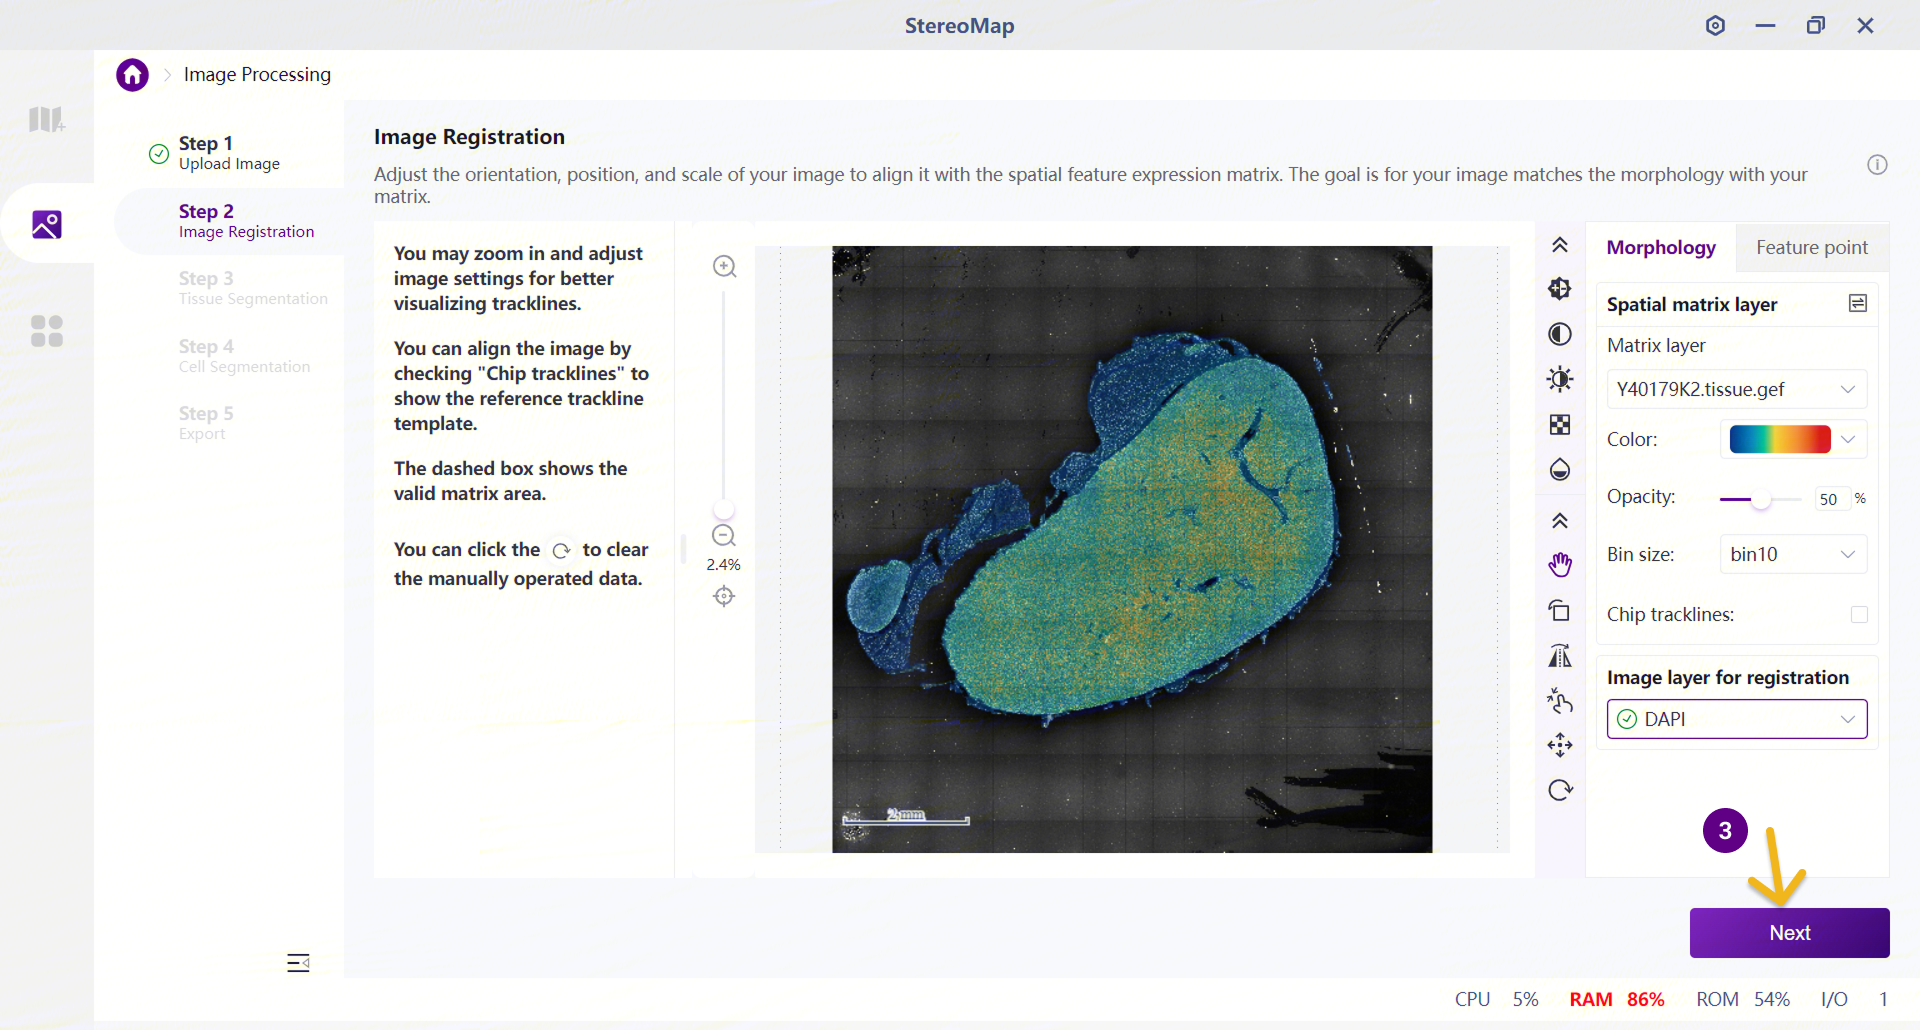
If you manually adjust the registration during this step, the spatial coordinates will change. You MUST re-run the initial "Multi-modal Cell Segmentation" script using the newly generated
*_regist.tiffile to create an accurate mask.Manually import the matrix and perform registration (Morphology or Feature Point).
Then click Next in Step 3 and Step 4 to reach Step 5: Export.
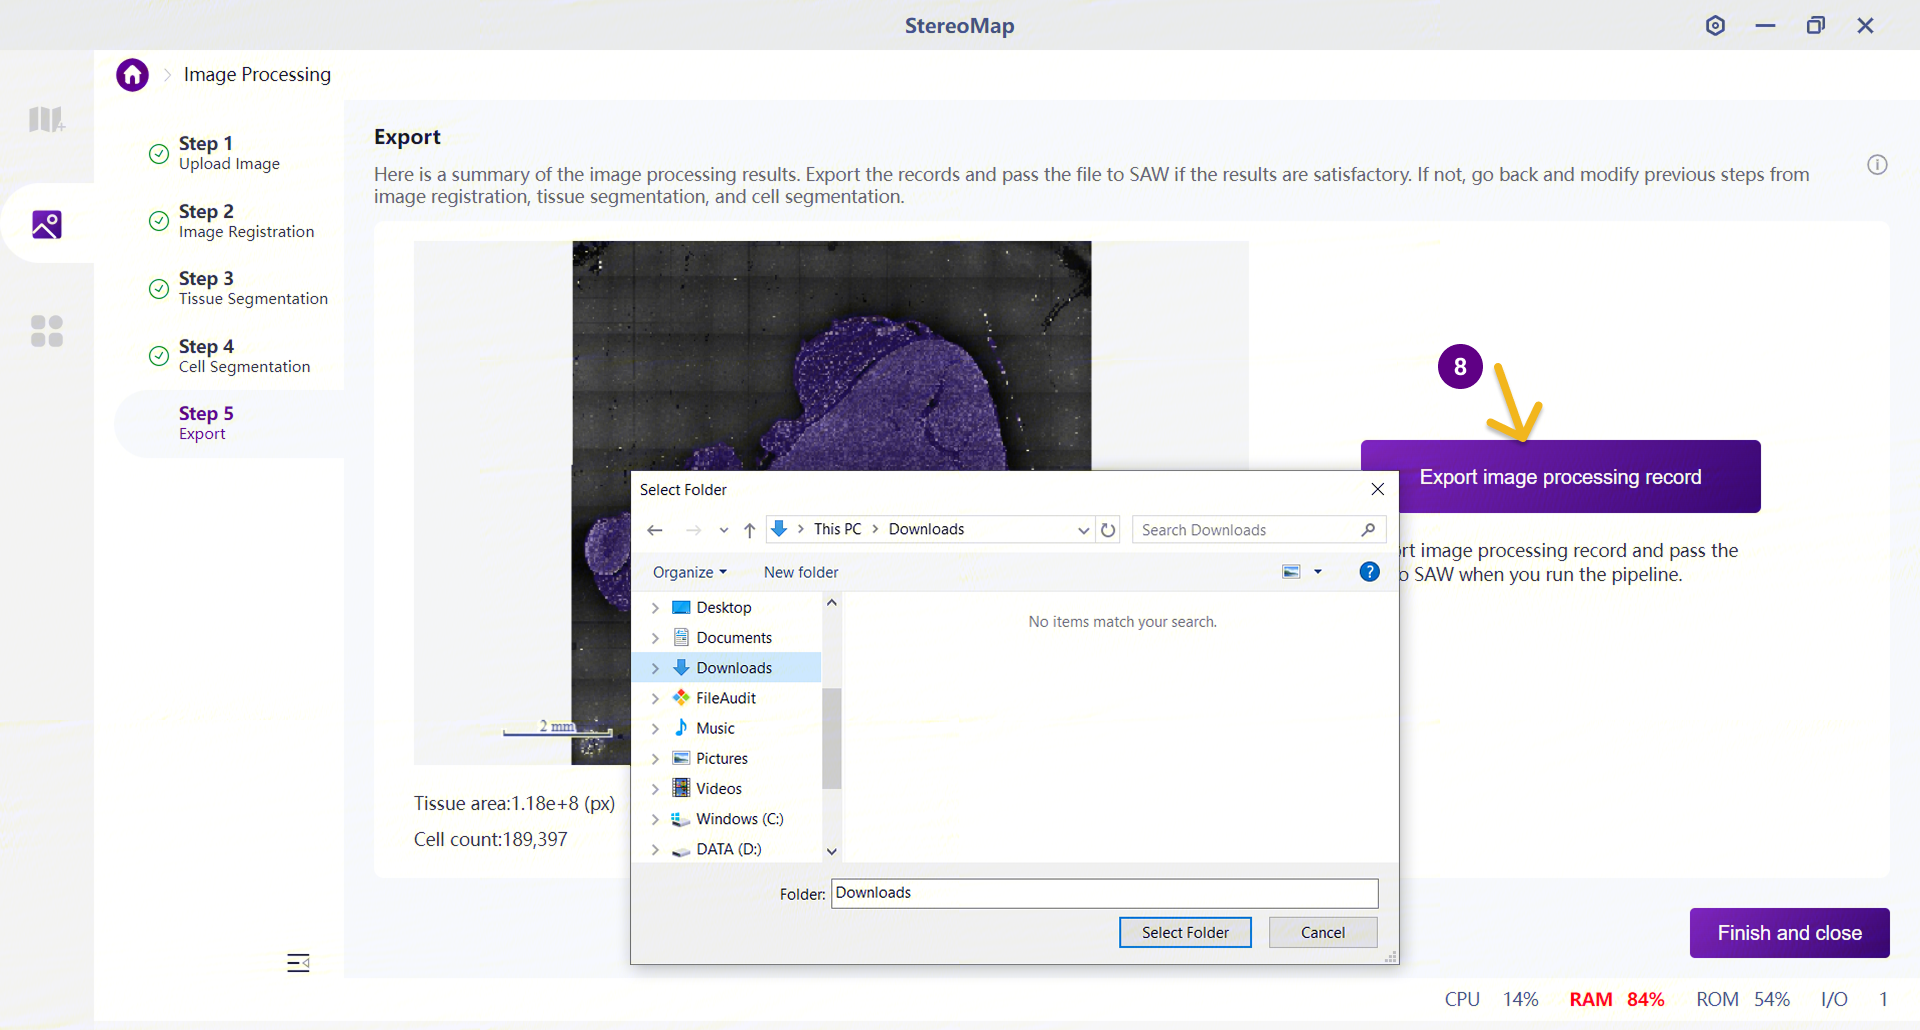
Export the results — a
*_regist.tiffile will be generated in your selected output directory.Navigate to Step 4: Cell Segmentation,open Segmentation mask dropdown menu.
Click the “+” icon next to Add mask option under Custom section.
In the file selection dialog that pops up, choose the multi-modal cell segmentation TIFF mask generated in the first step.
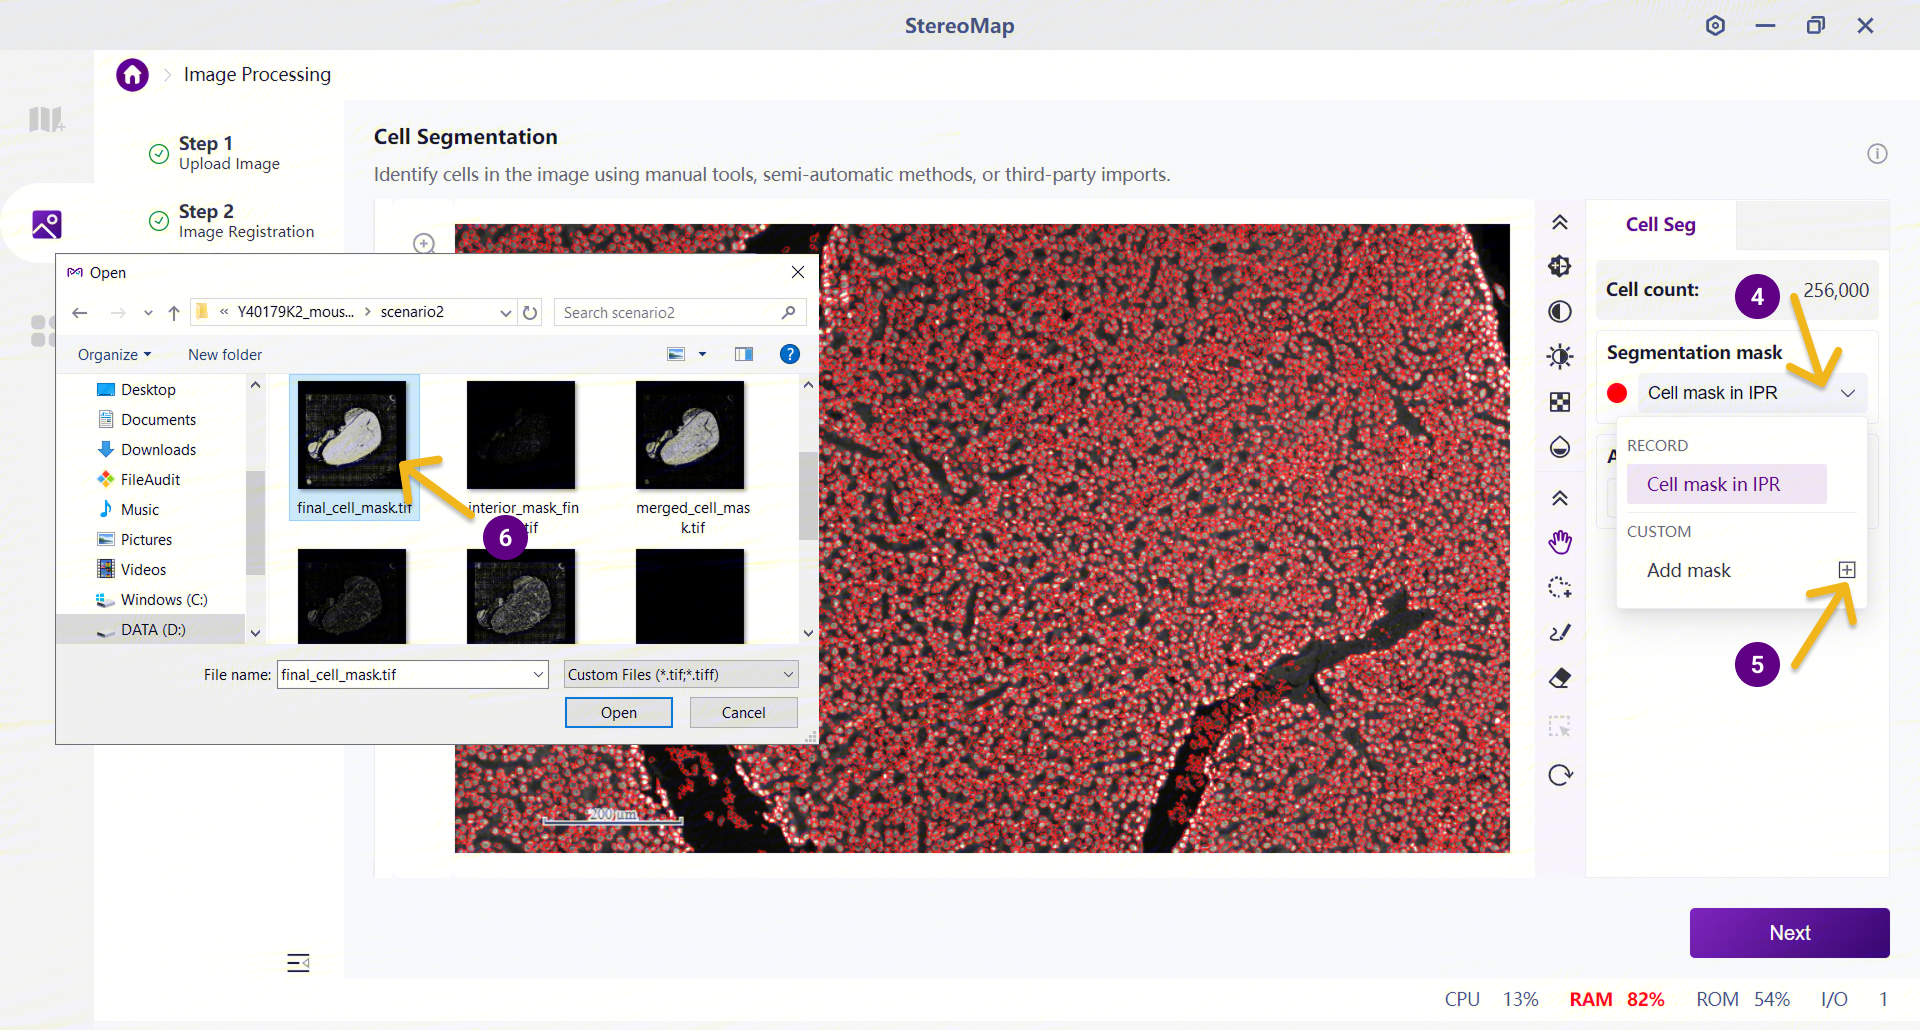
Upon successful import, the mask will be overlaid on the main canvas as cell outlines, with the registered microscope image displayed on the base layer below. Within this interface, you can zoom in and out of the canvas to evaluate the segmentation quality,and use the manual editing tools to adjust local regions. Following any adjustments, the software will automatically recalculate the total cell count. If the overall quality of the current mask is unsatisfactory upon inspection, select and upload a new TIFF mask. It will seamlessly overwrite the existing one.
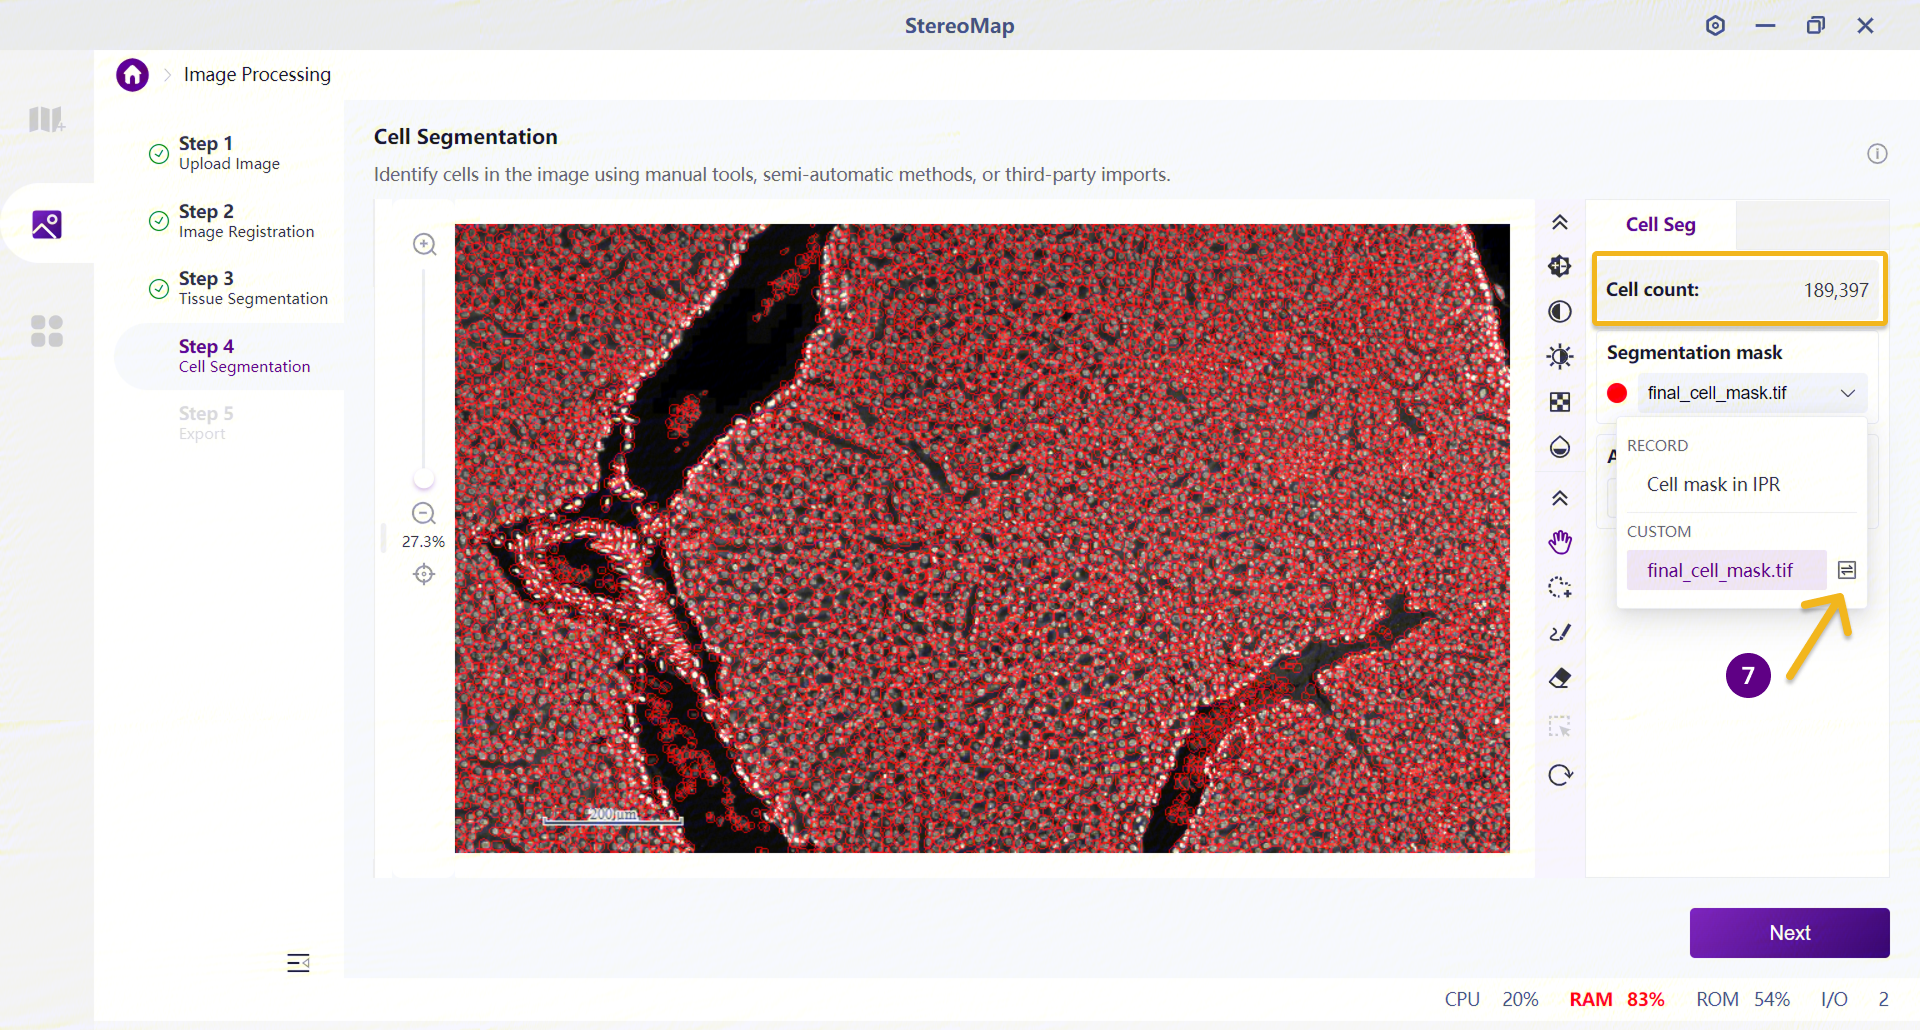
After replacing the mask, go to Step 5: Export and select the output directory to save the updated results.
Recalculate the CellBin Matrix
Upload the image
.tar.gzpackage exported from StereoMap to the server where SAW is installed, and run it through the SAWrealignpipeline. This process will regenerate the CellBin matrix based on the multi-modal cell segmentation results.# Input the updated image .tar.gz into the saw realign pipeline to regenerate the CellBin matrix
saw realign \
--id=Y40179K2_realign \
--sn=Y40179K2 \
--count-data=Y40179K2_Mouse_Kidney \
--realigned-image-tar=Y40179K2_SC_20260415_153736_4.3.0.tar.gz \
--threads-num=24Note that the
--count-dataparameter should point to theSAW countoutput directory that was used in Step 1 when the.stereofile was submitted.After the pipeline finishes, the
.cellbin*.h5adand.cellbin.geffiles in theoutsdirectory are the newly generated cell matrices based on the multi-modal cell segmentation results. The cell statistics and clustering shown in the.htmlreport are also recalculated using these updated matrices.Download and extract the
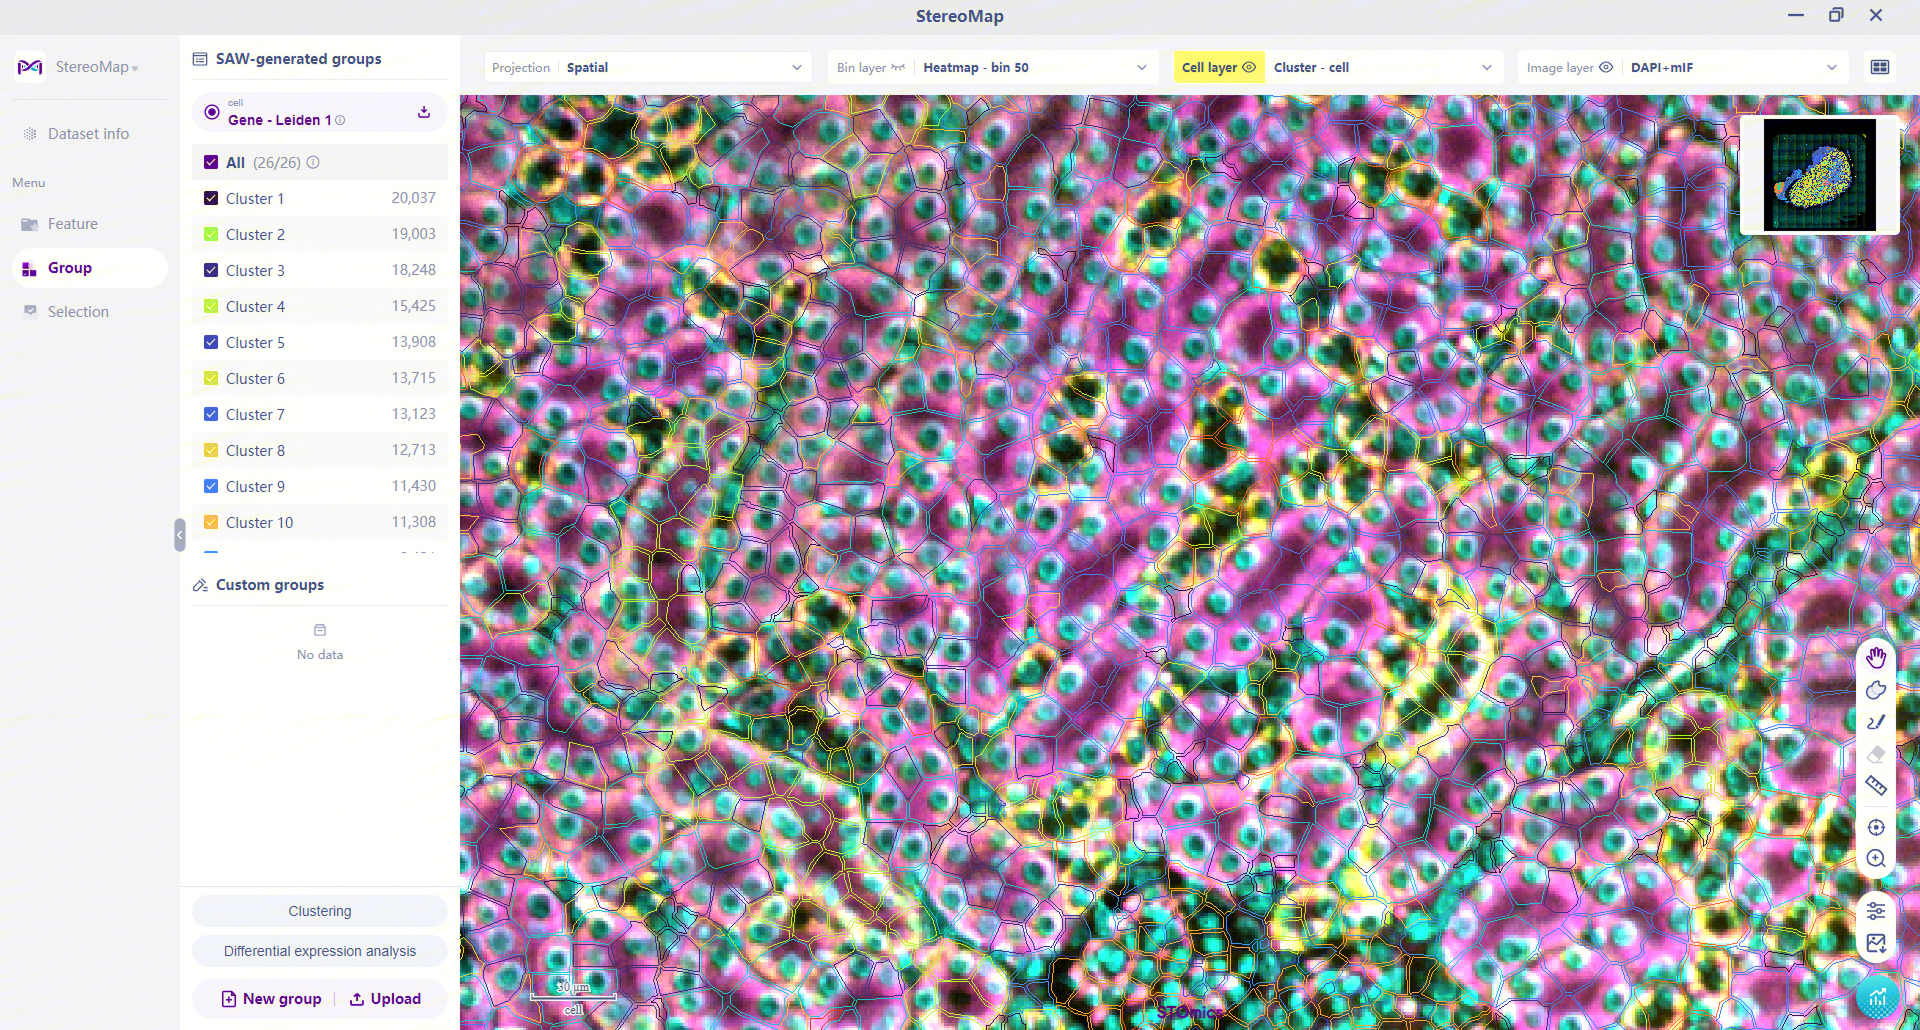
visualization.tar.gzfile, then import it into the Visual Explore module of StereoMap to view the spatial visualization of your updated CellBin matrix.
Real Boundaries. Real Biology.
Let's circle back to our original question: How do we define where a cell ends?
While standard geometric nucleus expansion gives you a quick, convenient approximation, multi-modal deep-learning segmentation maps the actual cellular boundaries present in the tissue. Moving to precise physical borders creates a powerful ripple effect across your entire downstream analysis—sharpening clusters, clarifying cell-type annotations, and uncovering true cellular communication signals.
Ready to see the difference in your own workflow?
🔬 Grab our curated sample data and test this end-to-end multi-modal pipeline on mouse liver tissue: Download Sample Data Archive
🛠️ Pull the multi-modal cellbin2 to spin up your own three-channel segmentations: Access cellbin2 feature/multimodal branch
📚 Bookmark this documentation series—our upcoming hands-on tutorials will continue to cover advanced analytics workflows and practical execution tips.
Have you successfully processed a dataset with this guide? Share your before/after matrix comparisons with our team! Exceptional user cases will be highlighted as featured spatial biology showcase assets.
Appendix: Quick Resource Reference
Version & Validation Notes: The steps outlined in this documentation were officially validated using SAW ≥ 8.3.0, StereoMap ≥ 4.3.0, the cellbin2 active cellbin2feature/multimodal branch, Cellpose 4.x.x, and Python 3.8 environments.