
1. What is SDAS
SDAS (Stereo Data Analysis Solution) is an "out-of-the-box, unzip-and-run" Linux command-line analysis toolkit developed by BGI STOmics for Stereo-seq spatiotemporal data. SDAS covers the entire analysis workflow from raw data preprocessing to figure output. Researchers no longer need to manually stitch together various scripts and tools — they can complete standardized, high-quality spatial omics analysis right away. SDAS also comes with a companion Analysis Guide and an advanced spatial analysis Pipeline.
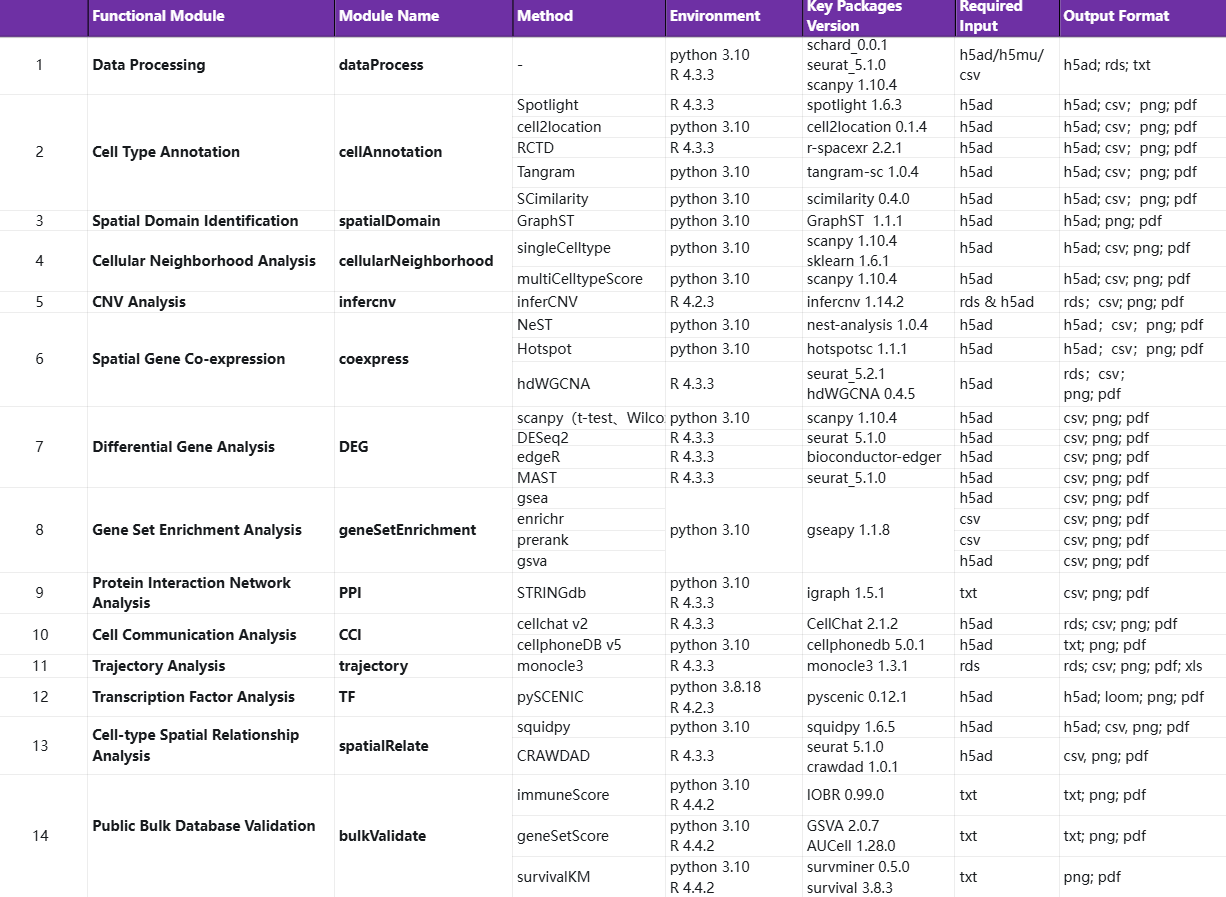
SDAS Toolkit: 14 analysis modules and 31 hand-picked, benchmark-validated algorithms. Modules are called via the command line, expose key parameters, and can be used independently or in combination.
Analysis Guide (Algorithm Benchmarking Column): For common spatial omics analysis tasks (cell type annotation, spatial co-expression, etc.), we benchmark algorithms across four dimensions — algorithm principles, parameter effects, computational resources, and results — and provide practical recommendations based on Stereo-seq data.
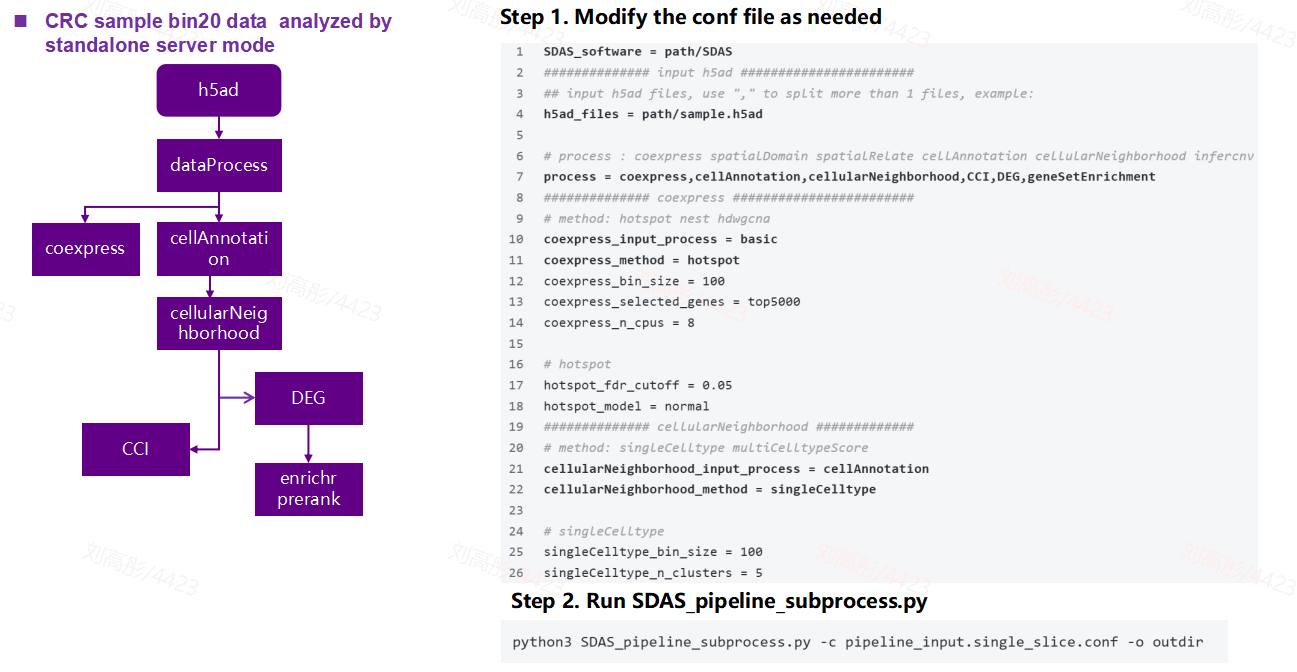
Advanced Spatial Analysis Pipeline: Chains SDAS modules into an executable Python workflow that follows a typical research logic. Comes with example data and a
confconfiguration file — no Snakemake / Nextflow required.
In short, the Analysis Guide answers "why use this algorithm," the SDAS Toolkit answers "how to use it," and the Pipeline answers "in what order to use it."
2. What Problems SDAS Solves
Through our conversations with research groups, we've noticed that spatial transcriptomics analysis commonly runs into three practical issues.
Limited analytical thinking. The most common scenario: after getting spatial data, researchers still follow the single-cell playbook — dimensionality reduction, clustering, differential expression, pathway enrichment. But these steps were already done at the scRNA-seq stage. Without analyses that leverage spatial coordinates, the final figures never actually show "where the cells sit in the tissue." The results end up looking no different from single-cell output, and the premium paid for the spatial experiment is hard to justify.
High cost of algorithm selection. For cell type annotation alone, the community offers many mainstream methods — cell2location, RCTD, Tangram, and more — with wide differences in accuracy, runtime, reference-set requirements, and GPU memory usage. Most researchers pick algorithms based on citation counts or in-group experience, without evidence tested on Stereo-seq data. Within a typical project cycle, they can usually only try 1–2 methods.
Time-consuming environment setup. cell2location's PyTorch dependencies conflict with Scanpy; CellChat's R packages don't match SeuratWrappers versions; different algorithms require different CUDA versions. Manually configuring a full spatial analysis stack usually takes 1–2 weeks — most of it spent troubleshooting the environment instead of doing analysis.
3. The SDAS Toolkit
3.1 Highlights
End-to-end coverage: A single tool that integrates 31 mainstream algorithms in the spatial transcriptomics field, wrapped into 14 analysis modules covering everything from raw data preprocessing to figure output.
Simple installation: On Linux, just unzip and use. All required dependencies are bundled and pre-compiled — no need to separately configure Python, R, CUDA, or any other complex dependency environments.
Ecosystem compatibility: Directly reads
.h5ad/.h5muoutput from STOmics' SAW analysis software, or works with AnnData / Seurat data prepared according to the user manual.
3.2 Overview of the 14 Analysis Modules
Regular single-cell transcriptomics tells you "which cell types are present and what genes they express" — but it loses the critical dimension of "where the cells are." Spatial transcriptomics keeps every piece of information single-cell gives you and additionally provides "spatial coordinates," unlocking a whole range of analyses that single-cell simply cannot do. The table below lists the full functionality of all 14 modules, and whether each module's chosen algorithm supports single-cell data as well or is spatial-only.
3.3 Module Algorithm List
4. Case Study: Tertiary Lymphoid Structure (TLS) Analysis in CRC
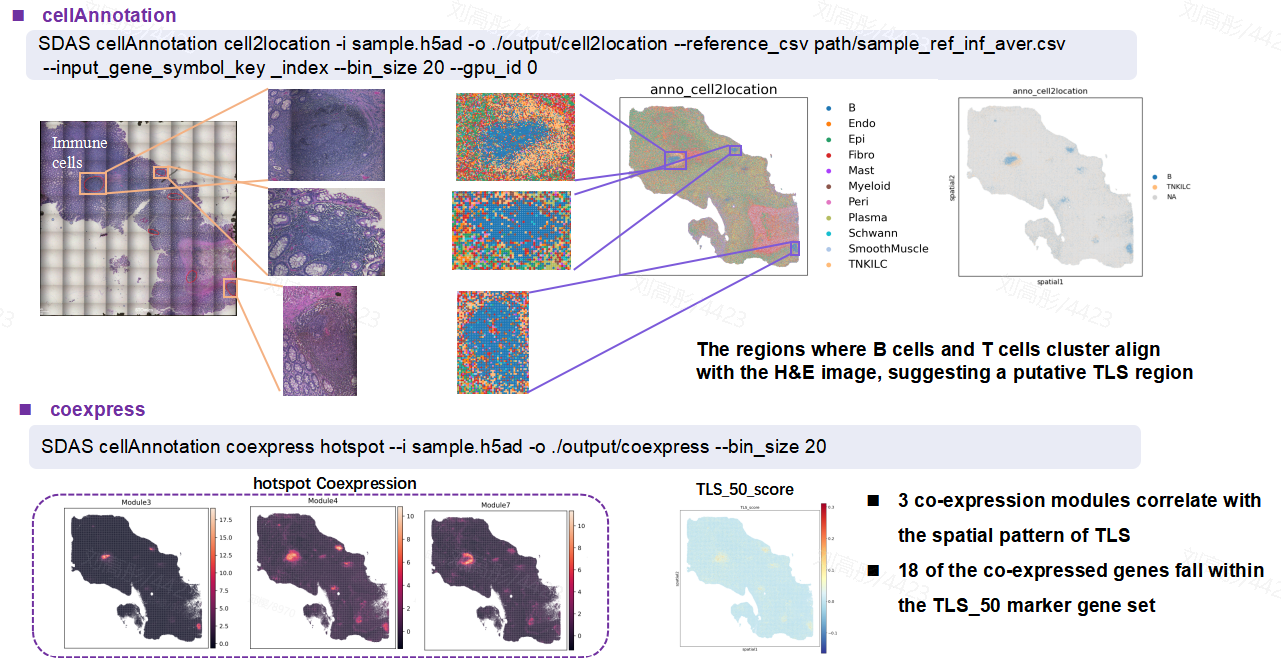
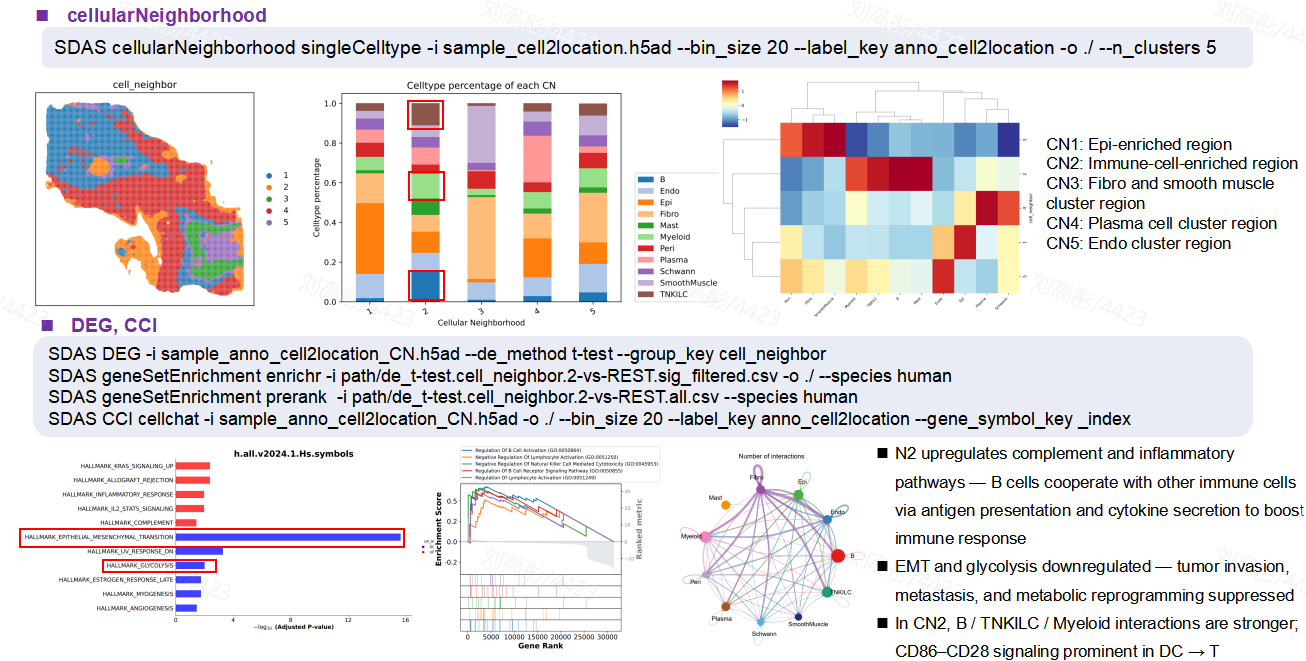
Using Stereo-seq bin20 data from a colorectal cancer (CRC) sample as an example, we show how SDAS identifies tertiary lymphoid structures (TLS) in tumor tissue and explores the link between TLS and tumor prognosis.
4.1 Advanced Spatial Analysis Pipeline Workflow
4.2 Key Steps and Findings
5. Algorithm Benchmarking Column
To help researchers make independent methodological choices beyond SDAS, we've launched an algorithm benchmarking column around mainstream spatial omics algorithms, structured as "theory + benchmark + recommendation." Two issues have been published so far:
5.1 Cell Annotation Algorithm Benchmark
Compares methods such as cell2location, RCTD, SPOTlight, Tangram, and SCimilarity on Stereo-seq data across different tissue types and resolutions, evaluating both accuracy and resource consumption.
STOmics official website: https://en.stomics.tech/resources/stomics-blog/1209.html
5.2 Spatial Gene Co-expression Algorithm Benchmark
Compares methods such as Hotspot, hdWGCNA, and NeST on Stereo-seq data across different tissue types and resolutions, evaluating both accuracy and resource consumption.
STOmics official website: https://en.stomics.tech/resources/stomics-blog/1210.html
6. Download and Usage
6.1 SDAS Installation Package and Pipeline
GitHub: https://github.com/STOmics/SDAS