The thymus is the primary site of T cell maturation, where adaptive immunity and central tolerance are established to prevent autoimmunity. Within this highly organized organ, developing T cells undergo stepwise selection across distinct compartments. In the cortex, cortical thymic epithelial cells (cTECs) support T-lineage commitment and positive selection. Surviving thymocytes then migrate to the medulla, where medullary thymic epithelial cells (mTECs) and dendritic cells (DCs) present peripheral tissue antigens to eliminate self-reactive clones through negative selection (Gamble et al., 2025). Among them, rare mimetic TECs adopt gene expression programs resembling peripheral tissues, enabling broad self-antigen presentation. Understanding the spatial organization and function of these cells is key to revealing the mechanisms underlying immune tolerance and autoimmune disease (Lehar & Bevan, 2002).
Overcoming the Bottlenecks of Conventional Transcriptomics
Characterizing the immense cellular heterogeneity and low-abundance cell states of the human thymus has long been constrained by technological limitations. While single-cell RNA sequencing (scRNA-seq) has successfully generated high-resolution "parts lists" of the thymic stroma, it fundamentally requires tissue dissociation, which strips away the critical spatial coordinates of cell-cell interactions (Li et al., 2024).
Conversely, early iterations of spatial transcriptomics platforms fell short due to poor resolution and restricted fields of view. Standard commercial spatial solutions typically rely on coarse-grained pixel sizes (such as 55 µm), which capture transcripts from dozens of overlapping cells simultaneously. In a highly compact organ like the thymus, this dilution effect makes it nearly impossible to isolate ultra-rare cellular subsets, such as specific mimetic TEC lineages that comprise less than 0.4% of the entire tissue section (Givony et al., 2023). For instance, previous studies attempting to map muscle-mimicking epithelial cells could project single-cell data onto spatial tissue, yet they failed to detect the definitive lineage-defining transcription factor MYOG in physical conjunction with the pan-epithelial marker EPCAM due to this voxel blending. Researchers were left blind to the exact structural niches, neighborhood compositions, and local signaling dynamics that drive central tolerance.
High-Resolution Multi-Omic Workflow and Architectural Mapping
To resolve these long-standing spatial ambiguities, modern spatial workflows combine genome-wide transcriptomics with targeted multiplexed proteomics to deliver an integrated multi-omic atlas. By optimizing sample preparation pipelines using robust cross-species validation, researchers can now seamlessly transition from mouse models to complex human clinical tissues.
The multi-stage analytical workflow integrates deep single-cell reference libraries with spatial data using advanced spatially constrained clustering and k-means stratification across diverse chronological milestones. This dual-engine approach allows tissue regions to be segmented via direct marker gene expression: the cortex is clearly demarcated by PRSS16 and PSMB11, the medulla by AIRE and FEZF2, and the connective tissue septa by CD34 and COL1A2. Beyond basic clustering, continuous tissue axis methods segment these regions into granular concentric niches, unmasking highly localized ligand-receptor networks. Cortical niches reveal an enrichment of SMPD3+ double-positive (DP) thymocytes governed by Midkine (MK) and Insulin-like Growth Factor (IGF) signaling. Meanwhile, medullary niches exhibit active chemotactic and antigen-presenting pathways, characterized by CCL19-CCR7 interactions and prominent CD74-CD44Macrophage Migration Inhibitory Factor (MIF) signaling hubs where MS4A1+ B cells and CD14+ dendritic cells colocalize.
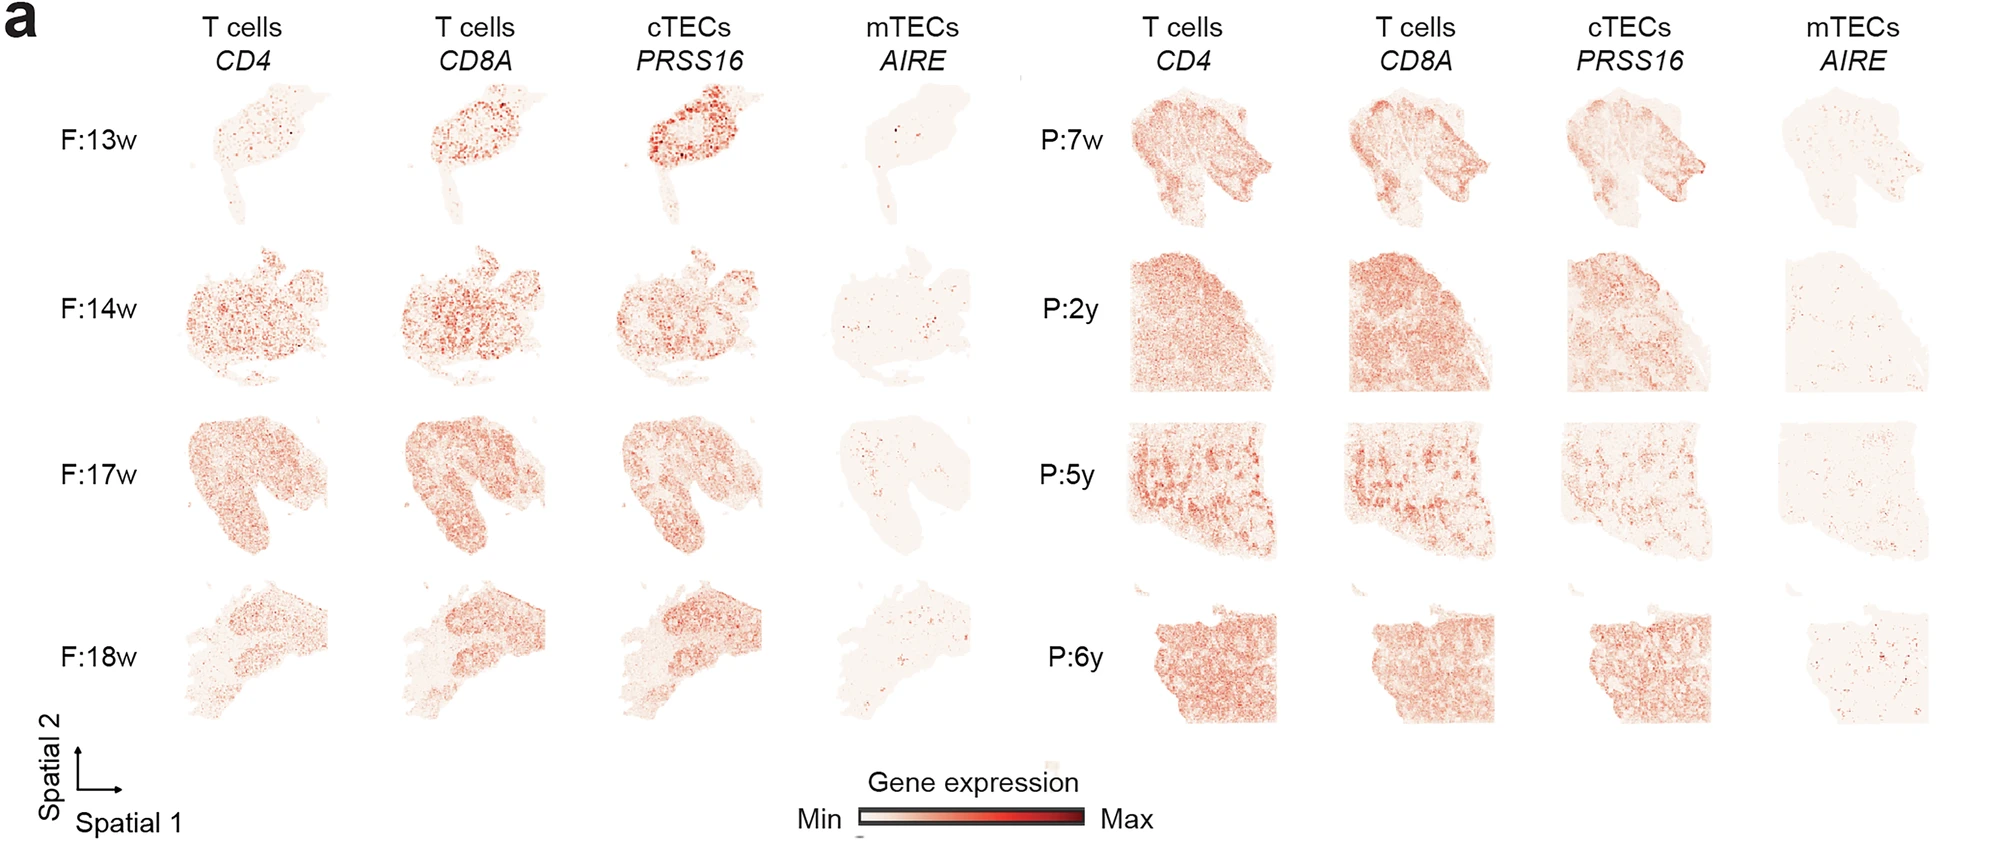
Figure 1. Expression profile of marker genes in the spatial transcriptomics atlas. The spatial gene expression of known markers for thymocytes (CD4 and CD8A) and TECs (PRSS16 and AIRE).
The Stereo-seq Transcriptomics Solution: Resolving the Unresolvable
The core breakthrough in achieving true single-cell-optimized spatial biology lies in the Stereo-seq Transcriptomics Solution. Powered by dense DNA nanoball (DNB) arrays, Stereo-seq features a unprecedented underlying 500 nm sub-cellular physical resolution, allowing researchers to analyze data at fine-grained bin sizes, such as bin 50 (25 µm spot diameter) or bin 20 (10 µm spot diameter for Stereo-CITE spatial multi-omics). This technical leap completely eliminates the blurring artifacts of legacy platforms (Yayon et al., 2024).
By leveraging Stereo-seq's superior resolution and centimeter-scale field of view, scientists successfully bypassed historical detection barriers to isolate and geoposition 70 distinct medullary-specific lineage-defining transcription factors (mimeTFs) directly within intact human fetal (13w, 14w, 17w, 18w) and pediatric (7w, 2y, 5y, 6y) thymi. While traditional technologies missed these signatures, Stereo-seq precisely captured the distinct extra-thymic programs driving tissue mimicry, including ASCL1 (neuronal development), INSM1 (pancreatic ß-cell differentiation), MYOG (skeletal muscle development), SOX2 (endocrine/eye systems), as well as BHLHE40, DLX5, and EGR3.
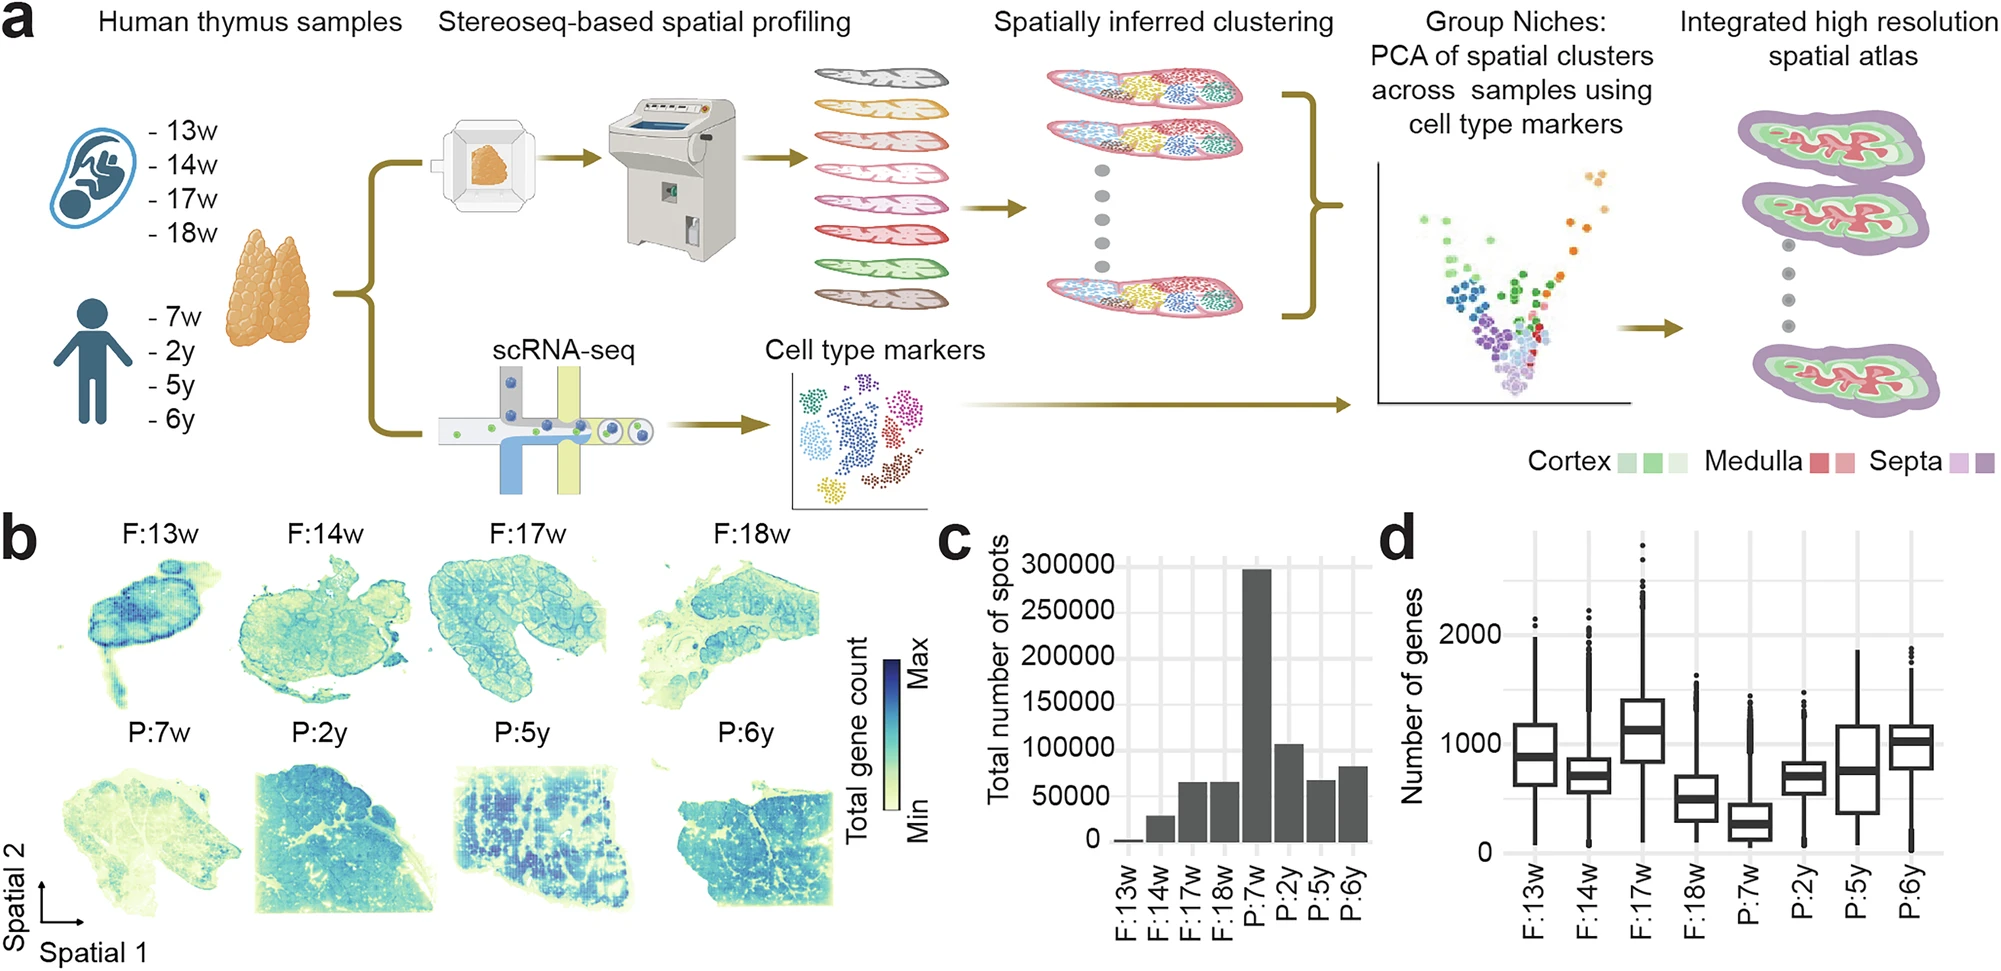
Figure 2. High-resolution spatial transcriptomic atlas of human fetal and pediatric thymus generated using Stereo-seq and scRNA-seq across developmental stages (13–18 weeks post-conception to early childhood), revealing spatial organization of cortex and medulla, distinct localization of thymocyte markers (CD4, CD8A), and diverse immune populations including B cells, dendritic cells, and macrophages.
Furthermore, Stereo-seq's ultra-large capture area proved to be a critical competitive advantage for translating morphology into absolute biological numbers. While pediatric thymic tissues frequently exceed several centimeters in length, standard 1×1 cm spatial chips force researchers to truncate their samples, losing macro-structural continuity. Stereo-seq overcomes this limitation by utilizing massive custom large chips (up to 2×3 cm). In pediatric 7w samples, this ultra-large area captured 297,572 spatial spots seamlessly, preserving the intact organ architecture and complete lobular morphology.
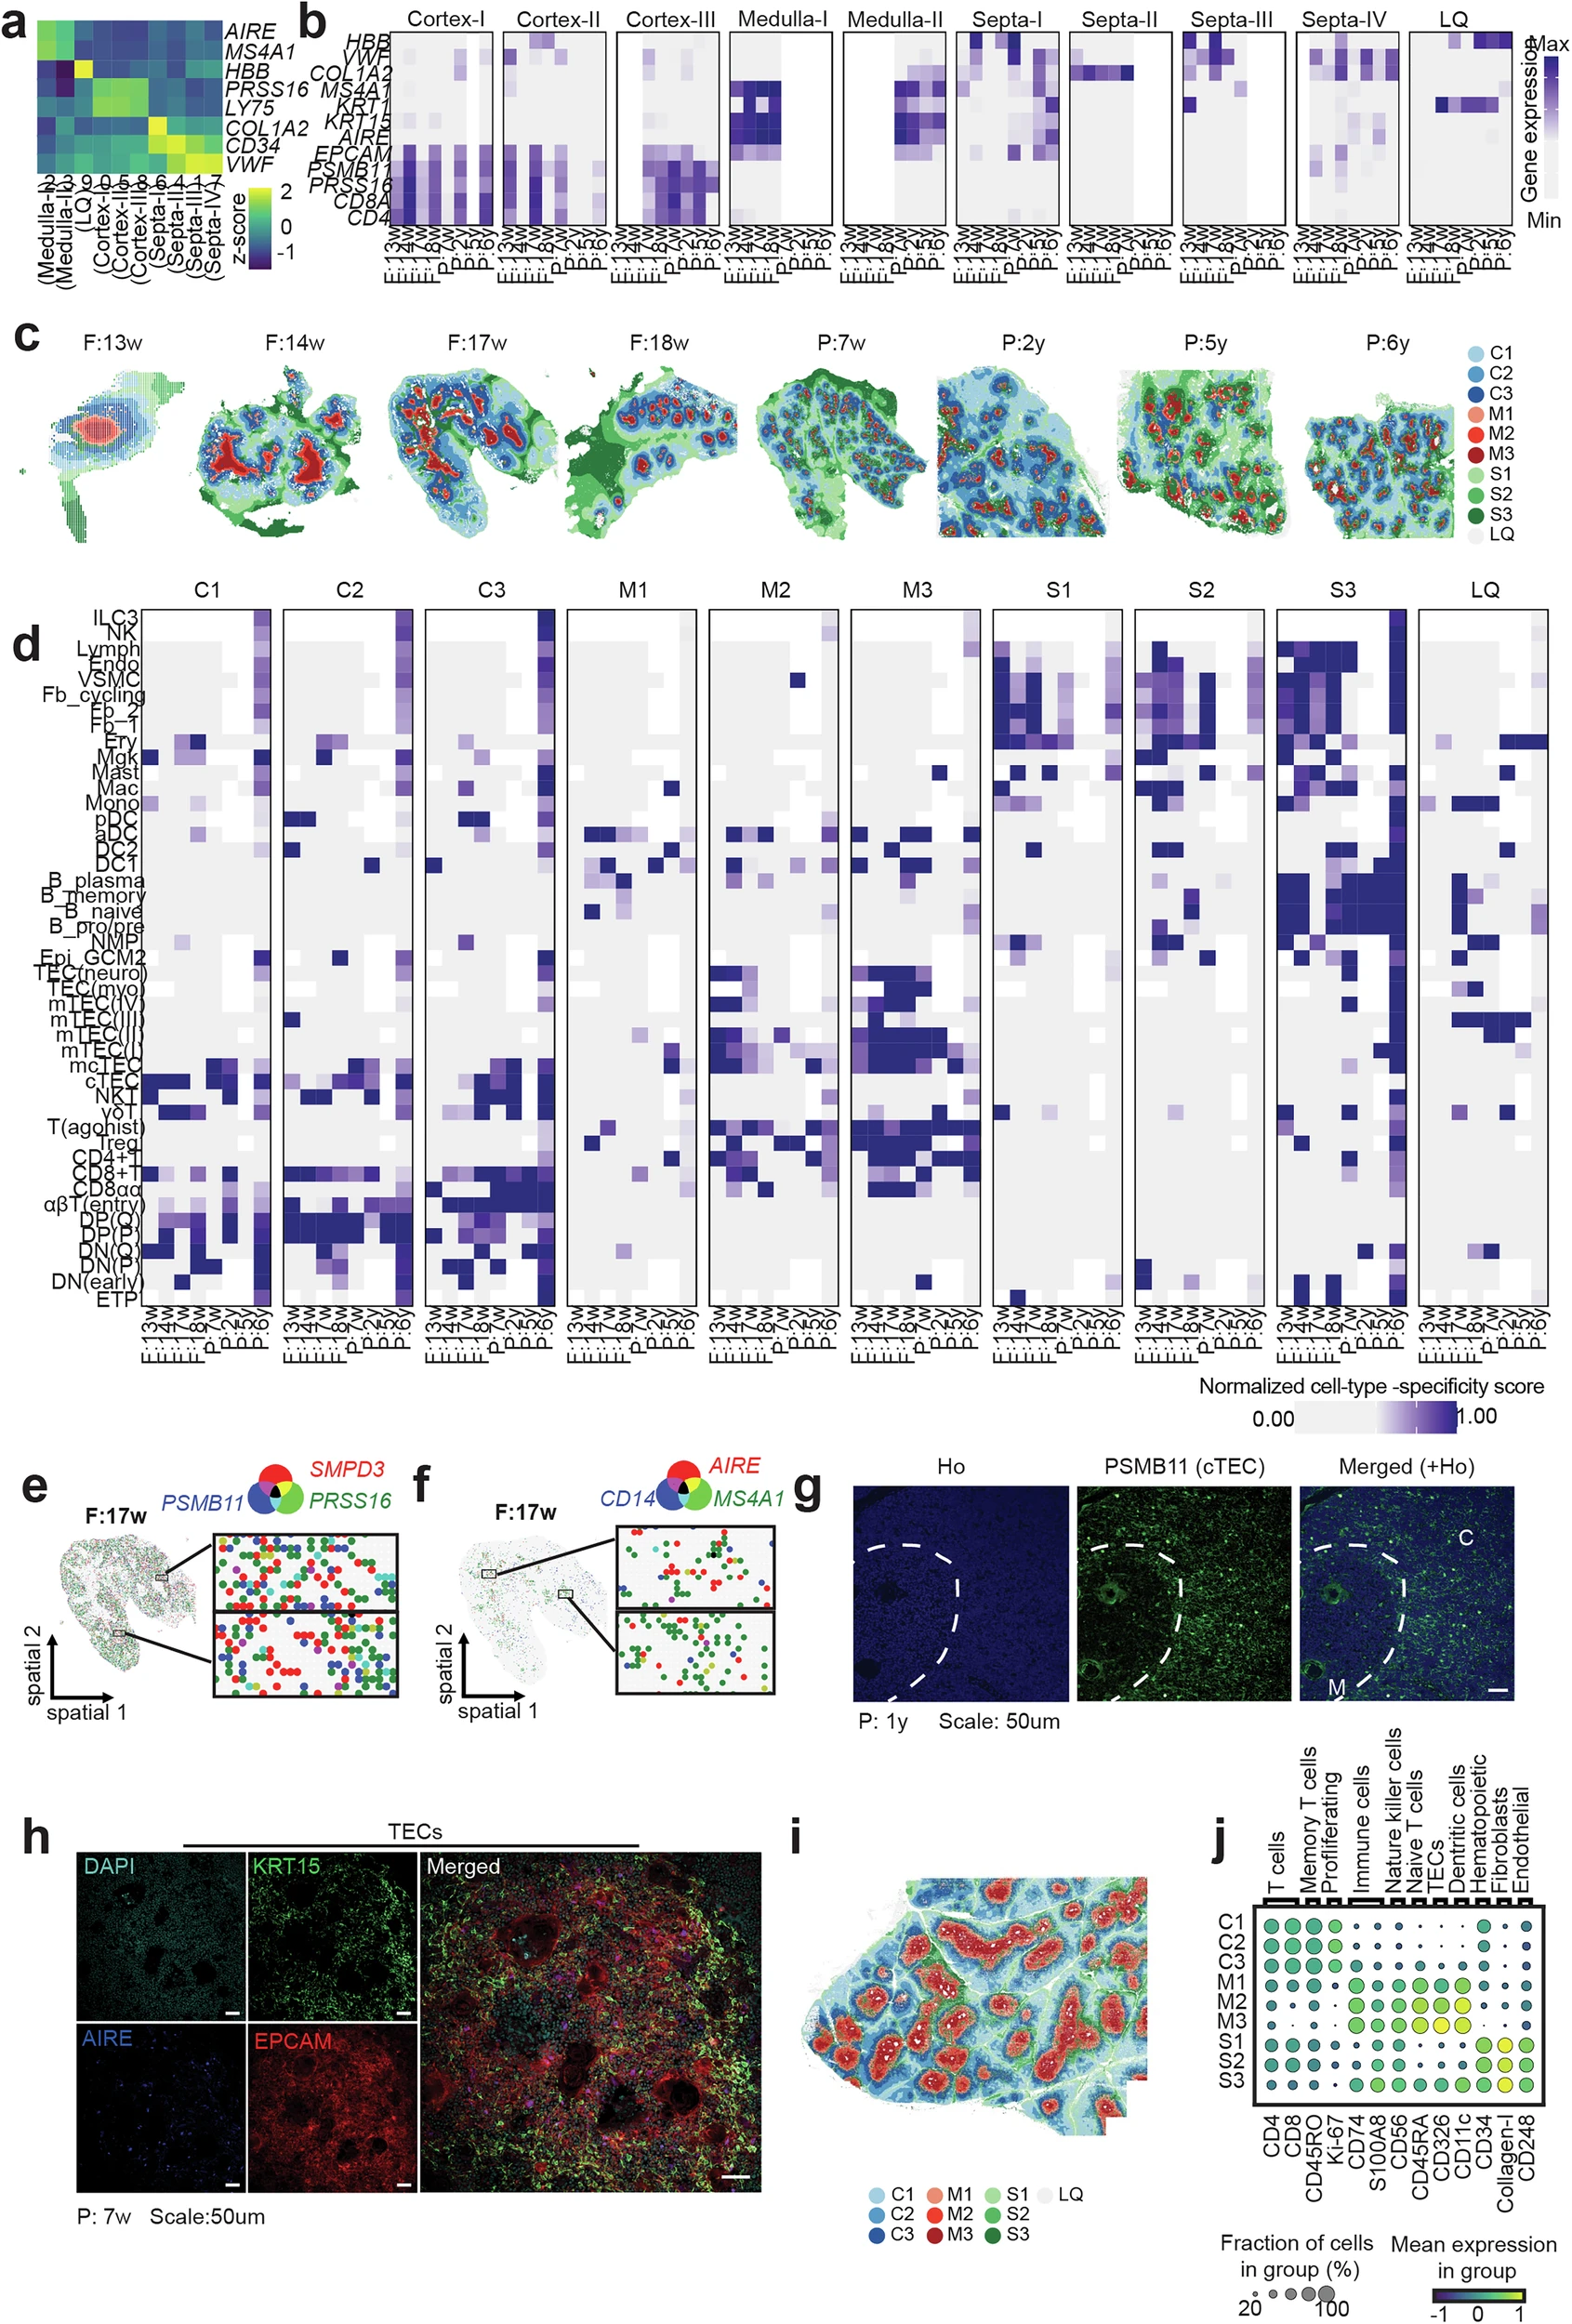
Figure 3. Spatial mapping of thymic niches across development. Stereo-seq resolved cortex, medulla, and septa across developmental stages, revealing age-resolved cell positioning and niche organization. Co-localization, immunostaining, and spatial proteomics together confirmed conserved thymic architecture from fetal to paediatric stages.
This scalability enabled advanced spatial co-occurrence and proximity network analyses that were previously impossible. Researchers discovered that rare mimetic TEC spots do not scatter randomly; instead, they form specialized regulatory hubs tightly clustered in close proximity to Hassall's corpuscles (HCs). Quantitative proximity metrics revealed that transcripts for the muscle lineage factor MYOG and the master tolerance regulator AIRE co-localize within the exact same spatial spot 6.5% of the time, climbing to 58.1% within a 5-spot radius, and reaching 74.2% within a 10-spot radius. Without Stereo-seq's sub-cellular resolution and expansive capture area, these rare presentation hubs would remain completely invisible.
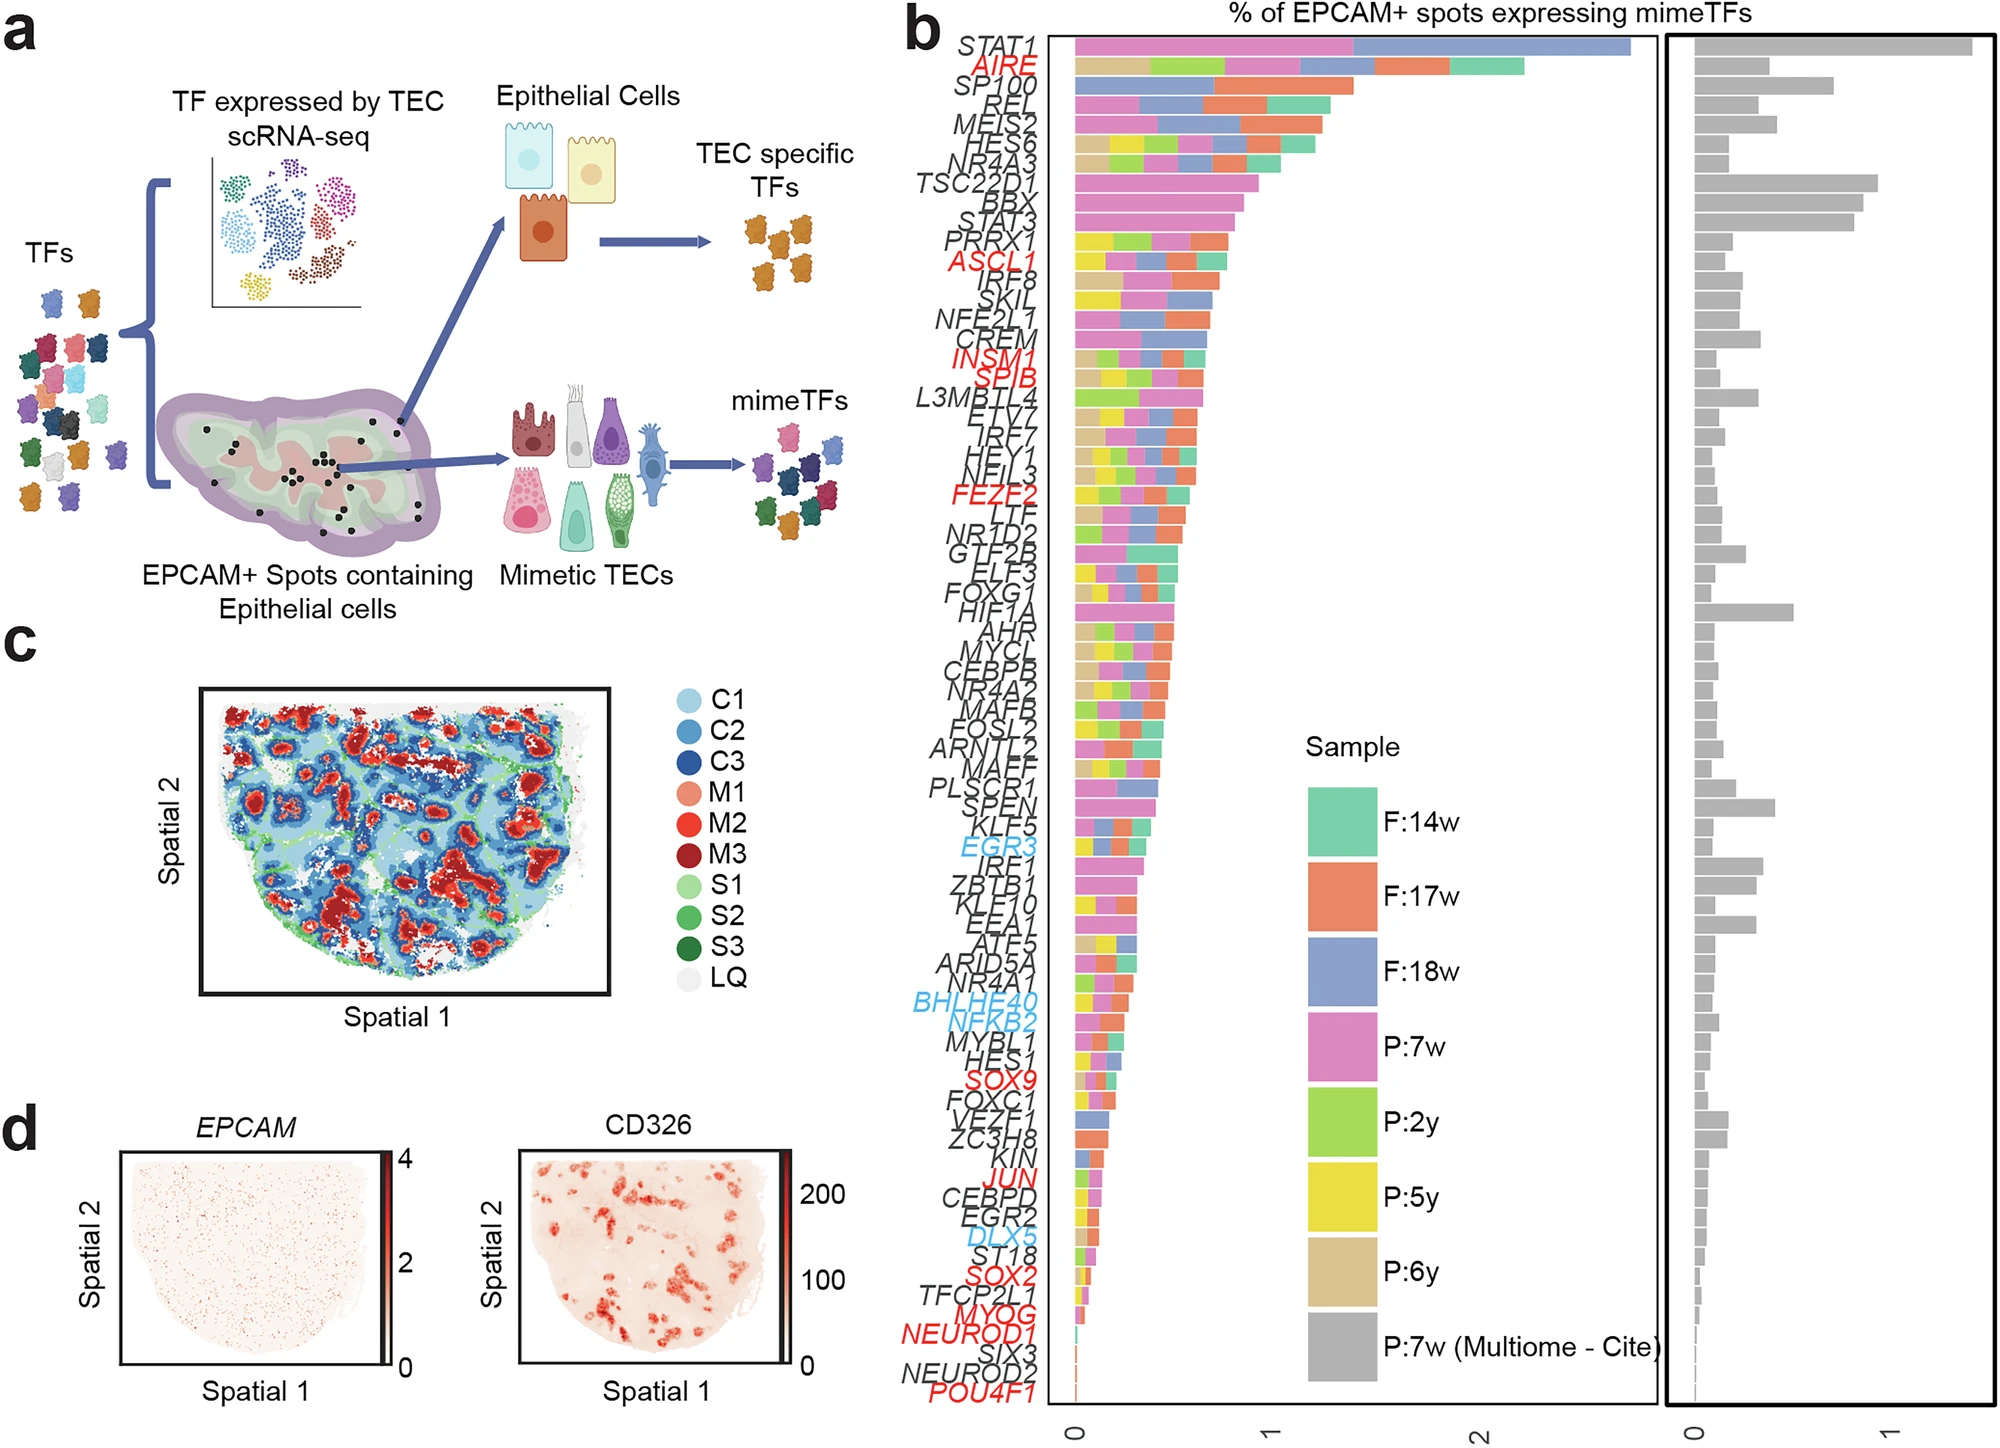
Figure 4. Identification of rare mimetic thymic epithelial cells (~0.4% of spatial spots) expressing lineage transcription factors such as AIRE, ASCL1, INSM1, and others, mapped in medullary regions using STOmics' Stereo-seq LCD (2*3cm) and Stereo-CITE (1*1cm) to reveal spatial clustering and potential roles in antigen presentation and immune tolerance.
STOmics' Stereo-seq Portfolio for High-Resolution Mapping
Deciphering the spatial logic of central immune tolerance within the human thymus—particularly the exact physical positioning of lineage-defining transcription factors inside ultra-rare mimetic epithelial cells—demands an analytical platform capable of resolving intricate cellular microenvironments without compromising macroscopic tissue architecture. To bridge this gap, the Stereo-seq Spatiotemporal Omics Portfolio offers an unparalleled suite of solutions engineered to redefine the boundaries of spatial biology.
Table 1. STOmics product matrix
Future Horizons of Spatio-Temporal Omics
As spatial biology moves toward total tissue digitization, the capabilities of Stereo-seq continue to expand. The immediate future of the technology lies in transitioning to true single-cell border imaging, combining high-density transcriptional capture with advanced cell-boundary staining to map real-time cell-cell boundaries in highly compact tissues. Furthermore, Stereo-seq is paving the way for multimodal spatial integration. By superimposing layers of chromatin accessibility (spatial ATAC-seq), epigenetic modifications, and RNA modification onto the existing transcriptomic-proteomic matrix, PI-led laboratories can unlock the complete spatial epigenetic-transcriptomic landscape of development, aging, and oncology.
Don’t Just Read the Science—See the Data Debut Live
Reading about the spatial atlas is only the first step; witnessing the primary data in action is where the real breakthrough happens. This Thursday, May 28, join lead researcher Dr. Uma Kamaraj from A*STAR’s Institute of Molecular and Cell Biology (Singapore) for the exclusive, first public presentation of this groundbreaking human thymus dataset. Dr. Kamaraj will walk you through the complete spatial atlas, demonstrating exactly how Stereo-seq and Stereo-CITE were leveraged to geoposition critical lineage transcription factors within ultra-rare mimetic epithelial cells across eight distinct developmental milestones.
📅 Date: Thursday, May 28, 2026
⏰ Time: 10:00–11:00 AM SGT (03:00 AM CEST | 11:00 AM JST/KST | 12:00 PM AEST)
💻 Format: Zoom Webinar (40-min technical talk + live Q&A)
📖 Published in: Nature Communications