All
Products
Resources
News
FAQ
Search
27/03/2025 Yahui Li, Ying Zhang, Mei Li
As spatial transcriptomics continues to advance, the ability to analyze and interpret spatially resolved gene expression data has become increasingly important. The Stereo-seq Analysis Workflow (SAW) [1] provides a standardized pipeline for processing Stereo-seq data, enabling single-cell resolution spatial analysis through its powerful CellBin algorithm, as discussed in our previous blog [2]. After successfully running SAW, you might wonder: What files does SAW generate, and what are their roles in the analysis process? SAW produces structured output files that not only support basic spatial transcriptomics analysis but also enable downstream advanced analysis, leading to more biological insights. In this blog, we will introduce the key output files generated by SAW, explain their generation process, and outline the methods for utilizing or converting them for advanced analysis.
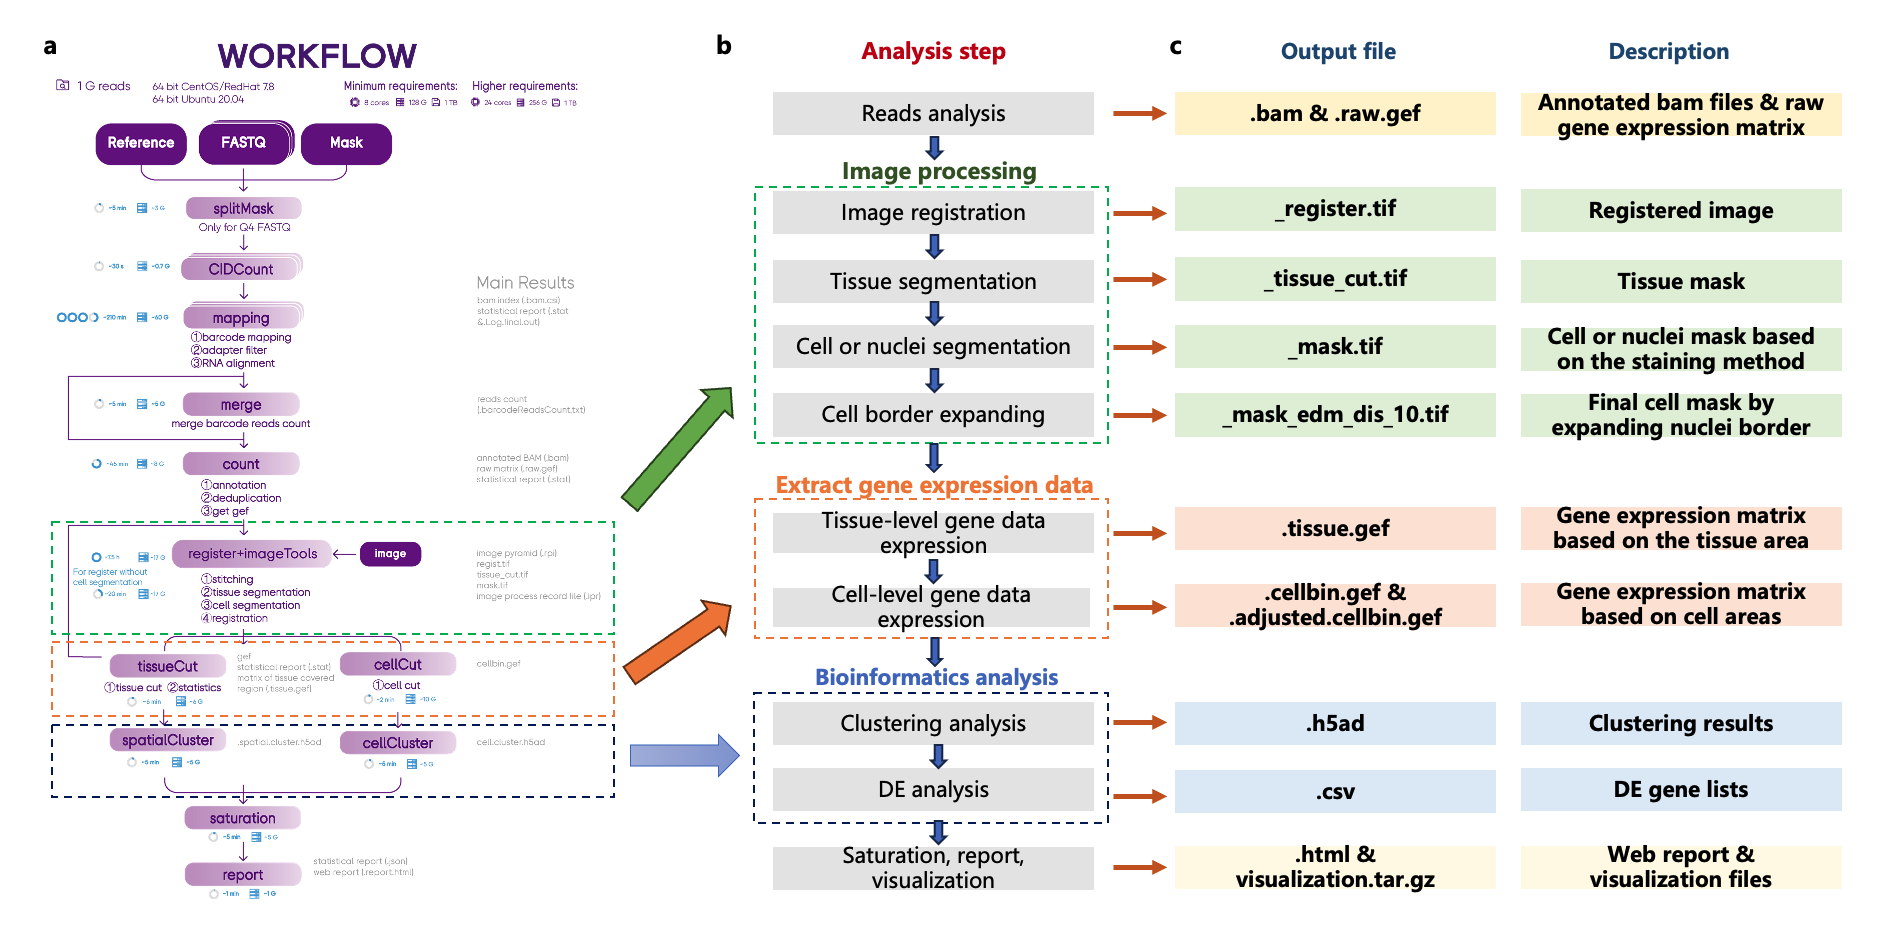
After a SAW run for Stereo-seq spatial transcriptomics analysis, the main outputs are listed in Table 1. To understand how SAW generates these output files, let's walk through the SAW workflow and examine where they are produced (Figure 1). The SAW analysis consists of five main steps:
Reads Analysis: After processing, the mapped and annotated reads and the raw spatial gene expression matrix are obtained. The latter is stored in the Gene Expression File (GEF) format, a specified gene expression data structure for Stereo-seq.
Image Processing: The image processing pipeline include image registration, tissue segmentation, cell segmentation, and cell border adjustment. This step generates a series of image files, providing spatial context for the gene expression data.
Gene Expression Extraction: Gene expression data are extracted based on tissue and cell segmentation areas and remain in the GEF format.
Bioinformatics Analysis: Bioinformatics analyses, such as clustering analysis and differential expression analysis, are performed on the gene expression data, revealing the preliminary spatial patterns.
Report and visualization output: Finally, sequencing saturation and statistics are calculated, the main results are summarized in an HTML report file, and the files required for visualization in StereoMap are compiled into a compressed file.
In summary, SAW produces two primary data types: gene expression-related data and image-related data, both essential for downstream visualization and advanced analysis. To better understand these data, we first introduce the Stereo-seq-specific gene expression data format (GEF file) and how it is used in downstream analysis. We then explore the key image files, including a series of mask files and the RPI file, which are crucial for data visualization and further analysis.
Table 1. Main outputs of SAW standard analysis
File/Folder | Description | Major data format |
bam/ | Alignment and annotation files | BAM |
image/ | Image files after registration | TIFF |
feature_expression/ | Feature expression matrices | GEF |
analysis/ | Secondary analysis results, including clustering and differential expression analysis | H5AD, CSV |
<SN>.report.html | HTML report with analysis results and statistics | HTML |
visualization.tar.gz | Files for data visualization in StereoMap | RPI, GEF, H5AD |
Note: The outputs are based on SAW V8.1.3. Outputs generated from previous versions of SAW may have minor differences.

Figure 1. SAW analysis workflow and corresponding output files. (a,b) Detailed steps of the SAW workflow. (c) Output files generated at each step, indicated by their file suffixes, along with descriptions.
GEF (Gene Expression File) is an HDF5-based data format specifically designed to efficiently manage and store spatial gene expression data in Stereo-seq. There are two types of GEF files: square bin (or simply, bin) and cellbin. The bin GEF file format is a hierarchically structured data model that stores one or more combined gene expression matrices across various bin sizes. The cellbin GEF file format, on the other hand, stores expression information within individual cells. Each GEF container organizes a collection of spatial gene expression matrices and includes two primary data objects: Group and Dataset. A Dataset is a multidimensional array of data elements, while a Group functions like a file system directory, organizing datasets and other groups hierarchically. The bin GEF contains group objects such as "geneExp", "wholeExp", and "stat". Each group or subgroup contains datasets. In contrast, the cellbin GEF focuses on gene expression data for cellbin unit and has a slightly different structure, including a layer called "cellBin". Figure 2 uses a cellbin GEF file as an example to illustrate the GEF data structure.
Meanwhile, the GEM (Gene Expression Matrix) is another Stereo-seq-specific data format, stored as a plain text file, designed to hold gene expression data in matrix format. Similar to GEF, GEM has two types: bin and cellbin. The bin GEM includes columns for gene ID, gene name, x and y coordinate, MID count, Exon Count with one file for each bin size. The cellbin GEM contains an additional column, cellID, which stores the cell ID information for each cellbin. The text-based format allows for quick viewing and processing using Linux command-line tools, text processing software (e.g., pandas), and spatial transcriptomics analysis tools (e.g., SpotClean).
For downstream analysis, GEF files can be easily converted into GEM and other widely used formats via the SAW convert utility, enabling integration with various single-cell and spatial transcriptomics analysis tools (Figure 2). Specifically, GEF files can be converted into the AnnData H5AD format for analysis in Scanpy, a popular Python-based framework. Additionally, conversion to the RDS format for use in Seurat, a widely used R package, is under development will be released soon. For more details on the SAW convert utility, please refer to the SAW User Manual under [Tutorials] – [Format Conversion]. Furthermore, GEF files can be directly processed by Stereopy, a Python package designed for spatial omics analysis [3,4]. Stereopy offers the best data format compatibility for Stereo-seq data, ensuring seamless integration and providing a suite of tools for advanced spatial transcriptomics analysis.
 and its data format conversion for downstream analysis..png)
Figure 2. GEF file structure (cellbin GEF example) and its data format conversion for downstream analysis. The GEF file comprises multiple layers, which can be converted into other formats via SAW convert for software compatibility or directly read by Stereopy for downstream analysis. The conversion to RDS is currently in development and is expected to release soon. Bold red text highlights commonly used downstream software for Stereo-seq.
SAW employs the CellBin algorithm for tissue and cell segmentation, generating multiple image files throughout the analysis. These files play a crucial role in image adjustments and data visualization, ensuring accurate spatial alignment and facilitating downstream analysis.
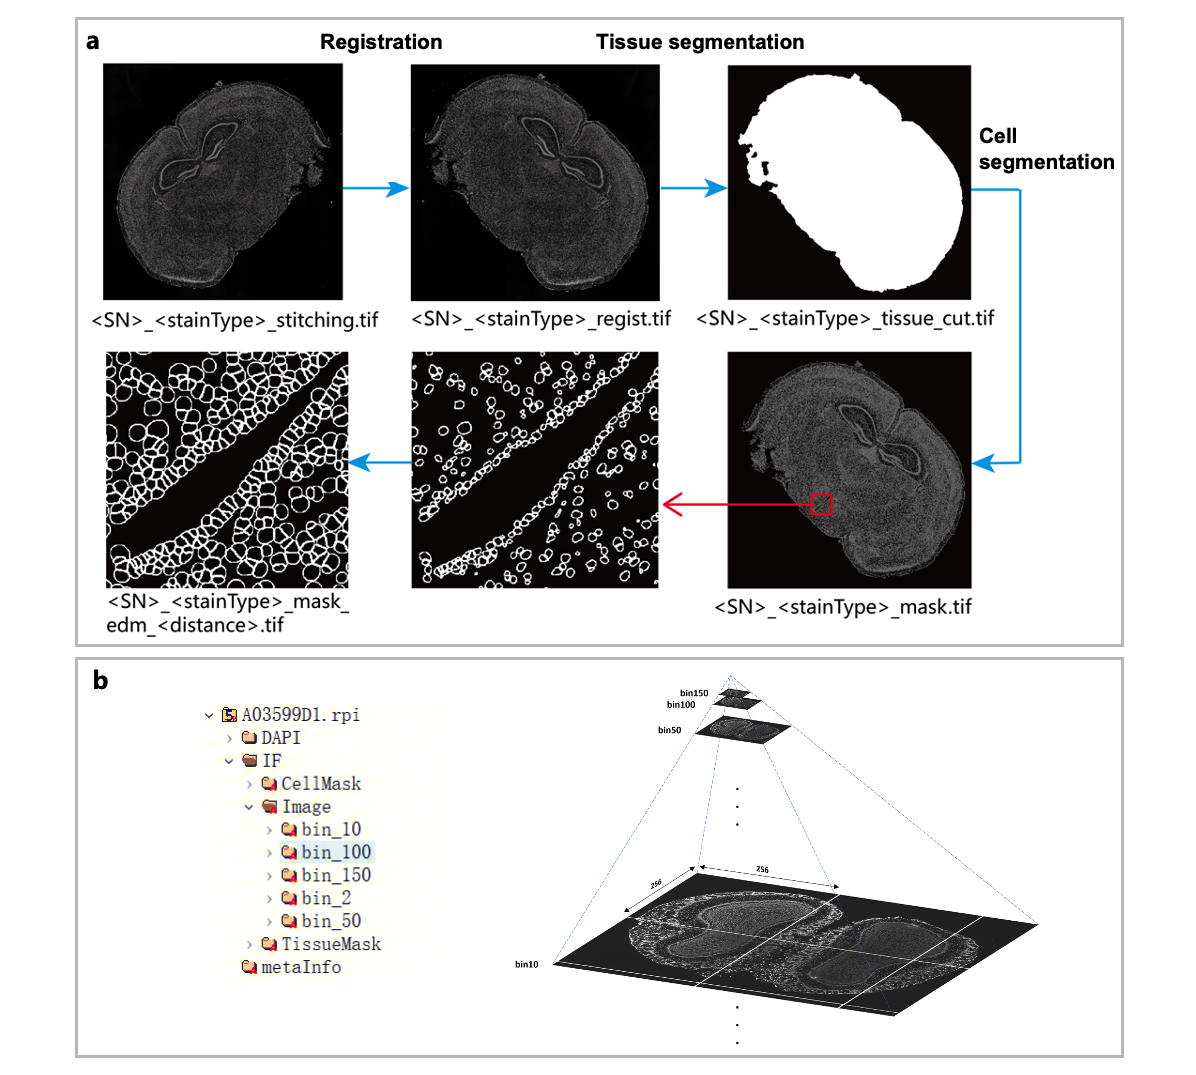
SAW requires input image data in TIFF format, either as raw microscope images (preferably stitched by microscope software if derived from small image tiles), or images processed through the Image QC. SAW processes these microscopic images to generate the tissue segmentation mask and cell segmentation mask, providing the necessary spatial context for the gene expression data (Figure 3a). The image processing workflow begins with image registration, where the microscopic image is aligned with the gene expression matrix by matching tracklines from both images. Adjustments are applied to the microscopic image, resulting in the registered image. Next, the tissue segmentation step employs semantic segmentation to delineate the boundaries of tissue coverage area, producing the tissue mask file. Then, the cell segmentation step identifies individual nuclei boundaries using nuclei staining fluorescent signal from the registered image, generating the nuclei mask. To refine cell segmentation, the nuclei border in this mask are expanded by a certain distance (10 pixels or 5μm in physical size by default in SAW), resulting in the final adjusted cell mask. Note that this expansion distance in SAW is adjustable (and can be set to 0) to accommodate different samples and imaging scenarios. All processed image data are stored in the image folder for further analysis and visualization.
To better visualize the data, SAW also generates a RPI (Recorded Image Processing) file, a HDF5-based format that employs a multi-resolution hierarchical model to store images in pyramidal structure, enabling visualization at different bin sizes. A typical SAW-generated RPI file organizes images sequentially by staining type (ssDNA, DAPI, H&E, or a protein IF name), image type (registered image, tissue mask, and cell mask), and resolution (bin 2, bin 10, bin 50, etc.). The RPI file can be accessed and explored by h5py (a python package) or HDFview software. Figure 3b (left) provides an example of the hierarchical structure within an RPI file, while Figure 3b (right) illustrates the pyramidal model, which stores images at multiple resolutions to optimize visualization across different scales.

Figure 3. Image-related files in SAW outputs. (a) Image processing workflow and the corresponding output files. (b) The RPI file, showing an example of an RPI file (left), and a diagram illustrating the pyramid structure used in RPI for multi-resolution image visualization images (right).
Both the GEF spatial gene expression data file and RPI image file are the input files for data visualization in StereoMap, with clustering analysis results stored in H5AD as an additional input file. These files are compiled into the visualization.tar.gz file. Users can directly visualize expression heatmaps, stained images, associated mask files, and clustering results by loading the decompressed visualization folder into StereoMap. Once the data appears satisfactory, users can proceed with advanced analyses using the tools we discussed earlier. For detailed instructions on how to explore your data in-depth, including step-by-step guidance, please refer to the StereoMap User Manual.
The Stereo-seq Analysis Workflow (SAW) generates a comprehensive set of organized output files essential for spatial transcriptomics analysis. This guide provides a fundamental overview of these outputs, highlighting gene expression data file (GEF) and image-related files (such as tissue masks, and cell masks, and RPI files), which serve as the foundation for both basic and advanced analyses. Additionally, The SAW convert utility seamlessly facilitates GEF data conversions, with new functionalities continuously being developed. By mastering SAW outputs, researchers can unlock the full potential of Stereo-seq data to advance spatial transcriptomics research. For further discussion or inquiries, feel free to contact us at info_global@stomics.tech.
1. SAW (V8.1.3 by Mar. 21, 2025) user manual gitbook: https://stereotoolss-organization.gitbook.io/saw-user-manual-v8.1
2. CellBin: The Core Image Processing Pipeline in SAW for Generating Single-cell Gene Expression Data for Stereo-seq. https://en.stomics.tech/news/stomics-blog/1017.html
3. Fang, S., Xu, M., Cao, L., Liu, X., Bezulj, M., Tan, L., et al. (2023). Stereopy: modeling comparative and spatiotemporal cellular heterogeneity via multi-sample spatial transcriptomics. bioRxiv, 2023.12.04.569485; doi:https://doi.org/10.1101/2023.12.04.569485 (Recently accepted by Nature Communications and in press)
4. Stereopy GitHub: https://stereopy.readthedocs.io/en/latest/