All
Products
Resources
News
FAQ
Search
13/06/2025 STOmics Tech
Note: STOmics Tech does not provide support for community-developed tools and makes no guarantees regarding their function or performance. Please contact tool developers with any questions. If you have feedback about this blog, please email info_global@stomics.tech.
In spatial transcriptomics research, accurate cell boundary identification is a critical foundational step to ensure reliable subsequent analyses at single-cell resolution. To best match the high-resolution features of Stereo-seq data, we integrated a deep-learning cell segmentation algorithm into the SAW analysis pipeline (see our previous blog [1] for details). This U-Net-based algorithm achieves high-precision cell segmentation through targeted training and parameter optimization using large-scale Stereo-seq datasets. Nevertheless, due to training datasets covering limited species variety, cellular morphological heterogeneity, and staining protocol variations, this method may still demonstrate suboptimal performance in practical applications.
To identify alternative methods to SAW’s built-in algorithm, we performed a comprehensive evaluation of popular community tools. This study originates from recent work by the STOmics research team, who established a benchmark dataset CellBinDB and conducted systematic performance tests [2]. Here, we present benchmark results comparing eight cell segmentation tools across four typical staining conditions (DAPI, ssDNA, H&E, and mIF). Our data-driven recommendations provide researchers with guidance for selecting optimal segmentation algorithms based on specific experimental conditions.
Furthermore, for special cases involving poor-quality images or no staining, we introduce two segmentation-free alternative methods based on molecular spatial distribution features. These approaches have demonstrated practical feasibility in real-world data analysis applications.
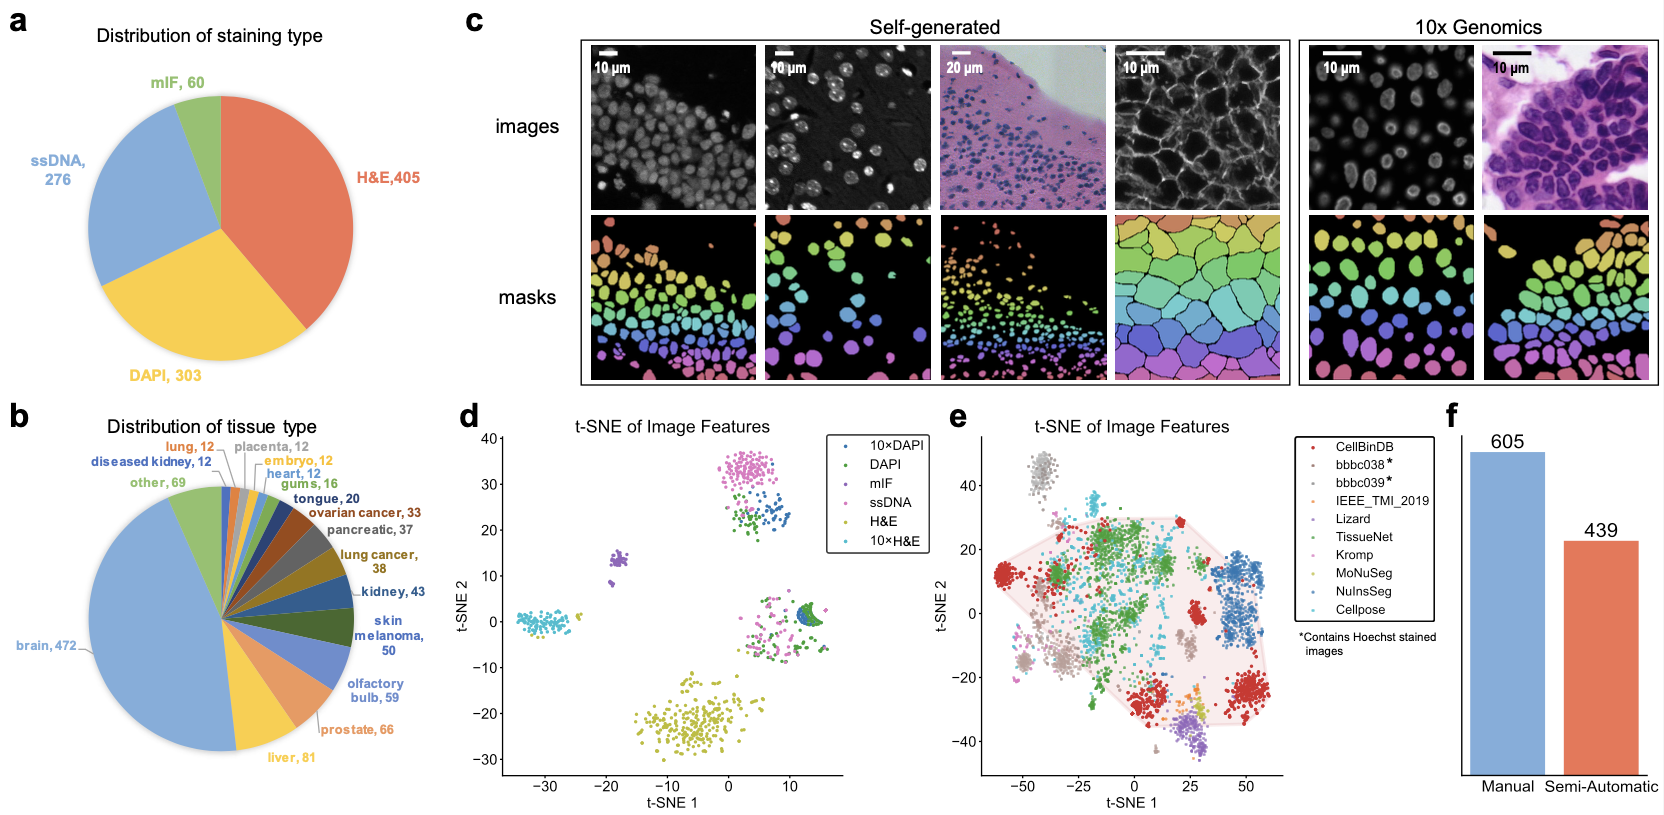
Our benchmarking dataset was sourced from the CellBinDB platform [2], comprising 1,044 annotated microscopy images with 109,083 cell annotations. The dataset covers four staining modalities (DAPI, ssDNA, H&E, and mIF) and includes 35 distinct tissue types from both human and mouse specimens. The image collection consists of 844 mouse tissue images generated in-house using Stereo-seq technology, supplemented with 200 human tissue images obtained from the 10x Genomics open platform. Compared to existing public datasets, our dataset demonstrates superior diversity in imaging characteristics. For cell annotation quality control, 605 images were fully manually annotated, while the remaining 439 images were annotated using our in-house CellBin algorithm followed by manual verification, collectively establishing the gold standard for cell annotations in this benchmarking study.

Figure 1. Overview of CellBinDB. a-b) Distribution of staining methods and tissue types in CellBinDB. c) Representative images from CellBinDB. d) Diversity distribution of staining methods and data sources in CellBinDB. e) Comparative analysis of dataset diversity between CellBinDB and other published datasets. f) Quantitative breakdown of manually annotated versus semi-automatically annotated images in CellBinDB.
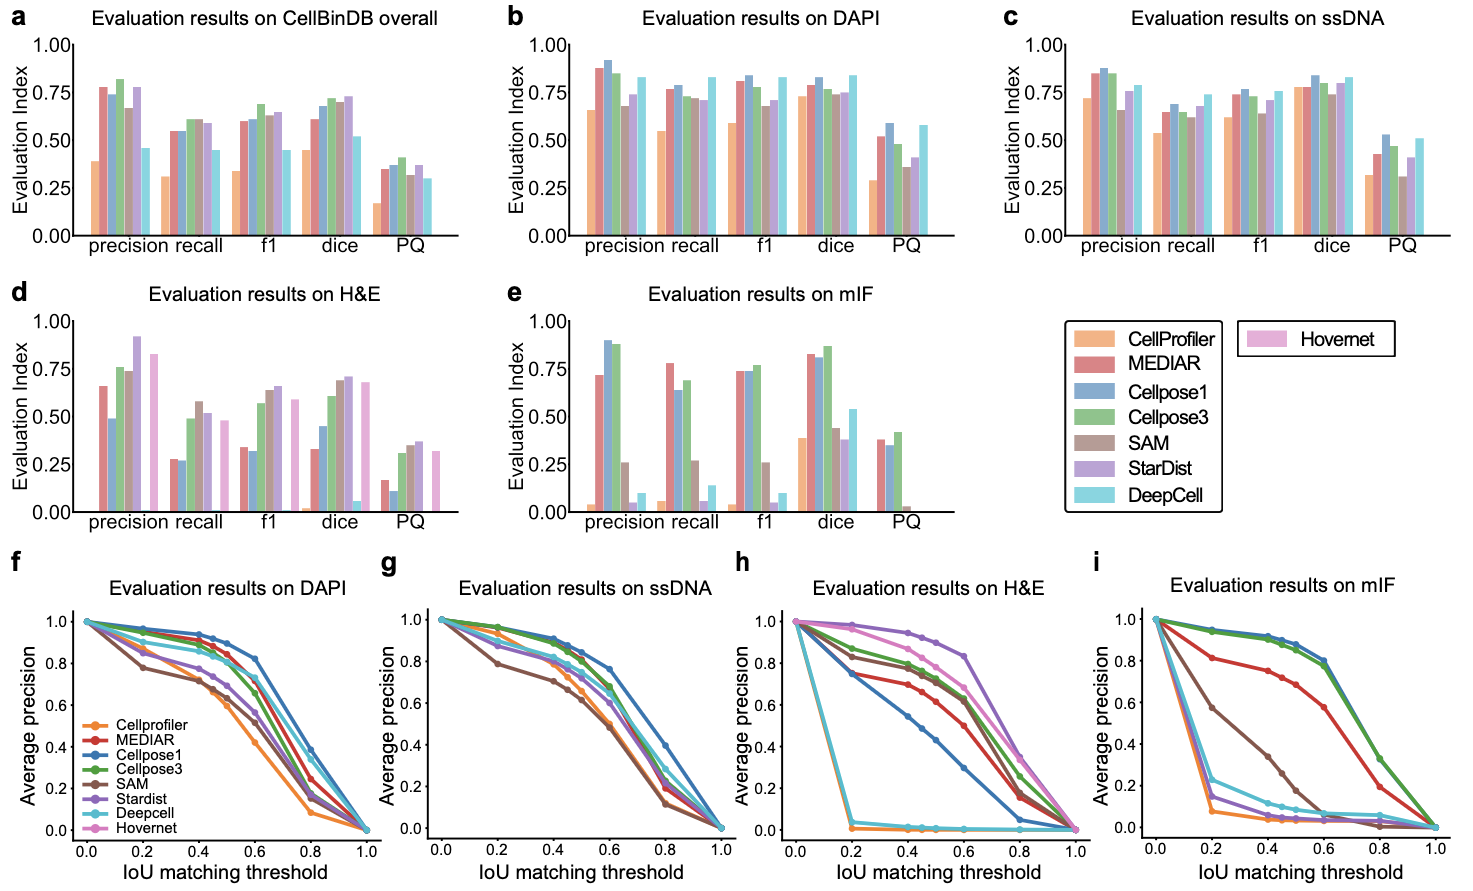
We conducted a comprehensive benchmark evaluation of eight mainstream cell segmentation tools (Cellprofiler, MEDAIR, Cellpose1&3, SAM, StarDist, DeepCell, and HoverNet) using the CellBinDB dataset, assessing six key metrics: precision, recall, F1-score, Dice coefficient, Panoptic Quality (PQ), and AP-IoU curves. Precision quantifies the shape accuracy of segmented cells compared to ground truth, recall measures the detection rate of true positive cells, and their harmonic mean (F1-score) serves as our primary evaluation metric due to its balanced representation of both factors. The Dice coefficient evaluates pixel-wise segmentation accuracy, while PQ integrates both instance-level and semantic-level performance. All metrics follow a 0-1 scale where higher values indicate superior performance. All software except HoverNet was tested on four types of image data, while HoverNet was tested only on H&E dataset.
Using the whole dataset as the input, the comparative analysis revealed Cellpose3 as the top-performing model (F1-score = 0.70), while the majority software (MEDIAR, Cellpose1, SAM, StarDist) also perform quiet well. However, Cellprofiler and DeepCell ranked lowest, exhibited limited generalization capability.
In the staining-specific analysis, there were distinct performance patterns: for both DAPI and ssDNA staining, Cellpose1, Cellpose3, DeepCell and MEDIAR achieved optimal results; in H&E staining, StarDist (with specialized H&E weights), HoverNet (pathology-optimized architecture), SAM and Cellpose3 demonstrated superior performance; while for mIF staining, Cellpose1, MEDIAR and Cellpose3 proved most effective. These findings provide empirically validated guidance for selecting context-appropriate segmentation tools in computational pathology and spatial transcriptomics research.

Figure 2. Performance comparison of different models on the CellBinDB dataset. (a-e) Model evaluation results on: the entire dataset, and separately on DAPI-, ssDNA-, H&E-, and multiplex immunofluorescence (mIF)-stained images. (f-i) Average precision-intersection over union (AP-IoU) curves of model segmentation performance across the four staining modalities.
.png)
Figure 3. Representative cell segmentation results of different models across various staining modalities. a) ssDNA staining. b) DAPI staining. c) H&E staining. d) Multiplex immunofluorescence (mIF) staining.
We systematically ranked each software's performance across different staining types using F1-scores as the primary metric. Top-performing tools received our strongest recommendation, while those scoring below 0.3 were categorically marked as "not recommended." These comprehensive results are presented in Table 1, providing users with a quick reference guide for tool selection.
Table 1. Ranking of recommended cell segmentation software under different staining conditions. The recommendation level "⭐" is determined by F1-score ranking, and software with F1-score below 0.3 or not suitable (HoverNet not for DAPI, ssDNA and mIF) are not recommended and marked as "-".
Software | DAPI | ssDNA | H&E | mIF |
Cellprofiler | ⭐⭐⭐ | ⭐⭐⭐ | - | - |
MEDAIR | ⭐⭐⭐⭐ | ⭐⭐⭐⭐ | - | ⭐⭐⭐⭐ |
Cellpose1 | ⭐⭐⭐⭐⭐(Best) | ⭐⭐⭐⭐⭐(Best) | - | ⭐⭐⭐⭐ |
Cellpose3 | ⭐⭐⭐⭐ | ⭐⭐⭐⭐ | ⭐⭐⭐⭐ | ⭐⭐⭐⭐⭐(Best) |
SAM | ⭐⭐⭐ | ⭐⭐⭐ | ⭐⭐⭐⭐ | ⭐⭐ |
StarDist | ⭐⭐⭐⭐ | ⭐⭐⭐⭐ | ⭐⭐⭐⭐⭐(Best) | - |
DeepCell | ⭐⭐⭐⭐⭐ | ⭐⭐⭐⭐⭐ | - | ⭐⭐⭐ |
HoverNet | - | - | ⭐⭐⭐⭐ | - |
Notably, image-based segmentation methods often face limitations when processing low-quality images, such as those with low signal-to-noise ratios or high background noise, or when analyzing densely packed cellular structures where boundaries are obscured, as seen in epithelial layers or immune cell clusters. In such scenarios, molecular classification approaches that operate directly on expression matrices offer viable alternatives by circumventing traditional segmentation while still enabling subcellular-level clustering and annotation.
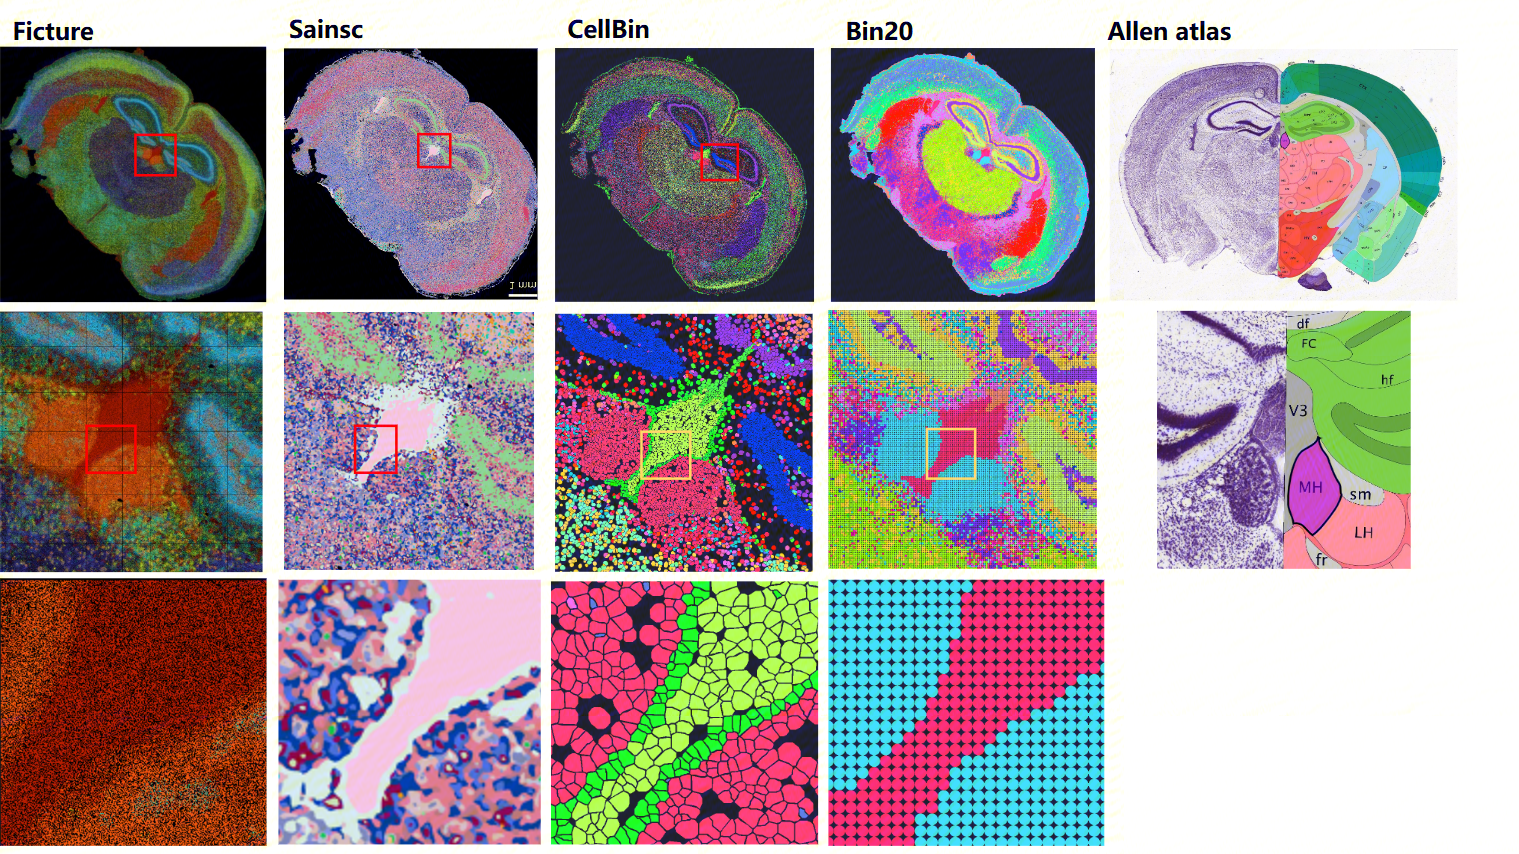
For these applications, we recommend the Ficture and Sainsc methods. Ficture employs a Dirichlet latent allocation model, while Sainsc is based on a kernel density estimation framework. Both support supervised and unsupervised clustering at native sequencing resolution. Our benchmarking using mouse brain data demonstrates their robust performance, with both achieving exceptional subcellular resolution at the Bin1 level (500 nm), where Ficture demonstrated a better clustering results compared to Sainsc. This performance advantage stands in contrast to SAW's built-in analysis units (cellbin and Bin20), which are limited to single-cell or single-cell equivalent resolution due to their fundamentally different analytical approaches.

Figure 4. Comparative analysis of unsupervised clustering performance among Ficture, Saincsc, cellbin, and Bin20 on mouse brain samples with detailed visualization. Brain antanomy reference is obtained from the Allen brain atlas (right). Top row: clustering results. Middle and bottom row: zoom-in view of the clustering results.
Image-based segmentation:
Cellprofiler: Traditional image analysis pipeline https://github.com/CellProfiler
MEDAIR: Harmonization strategy of data-centric and model-centric approachs https://github.com/Lee-Gihun/MEDIAR
Cellpose1 & Cellpose3: Deep learning-based segmentation for diverse cell types https://github.com/MouseLand/cellpose
SAM: Foundation model for generic object segmentation https://github.com/facebookresearch/segment-anything
StarDist: Nuclei segmentation with shape-aware constraints https://github.com/stardist/stardist
DeepCell: Deep learning framework for nuclear and cellular segmentation https://github.com/vanvalenlab/deepcell-tf
HoverNet: Pathology-optimized H&E image analysis https://github.com/vqdang/hover_net?tab=readme-ov-file
Our benchmarking implementation and evaluation code: https://github.com/STOmics/cs-benchmark
Segmentaion-free analysis:
Ficture: Dirichlet process-based spatial clustering https://github.com/seqscope/ficture
Sainsc: Kernel density estimation approach https://github.com/HiDiHlabs/sainsc
1. CellBin: The Core Image Processing Pipeline in SAW for Generating Single-cell Gene Expression Data for Stereo-seq https://en.stomics.tech/news/stomics-blog/1017.html
2. Shi, C. et al. (2025). CellBinDB: a large-scale multimodal annotated dataset for cell segmentation with benchmarking of universal models, GigaScience, 14(1), giaf069, https://doi.org/10.1093/gigascience/giaf069