All
Products
Resources
News
FAQ
Search
12/05/2025 Yahui Li, Leying Wang
Successful Stereo-seq analysis relies on precise image processing. Although the SAW pipeline automates the image analysis workflow, understanding each step's purpose remains crucial for interpreting results and troubleshooting errors. The STOmics team recently presented a in-depth webinar on Stereo-seq image analysis [1]. This blog distills the webinar's key concepts and explains the fundamentals behind these processing stages. Our goal is to provide you with the essential knowledge for Stereo-seq image analysis and to assist in troubleshooting any related issues you may encounter.
The standard Stereo-seq analysis workflow processes raw input data (FASTQ reads, image files, and chip mask data) through SAW software to generate a spatial gene expression matrix. This process consists of both read alignment and image processing. When SAW generates successful results, researchers can seamlessly proceed to downstream analysis. However, if image processing errors occur, users need to manually correct the images using StereoMap to resume the analysis workflow.
To effectively troubleshoot image processing issues, it's essential to understand the key stages (Figure 1): image quality control (QC), image registration, tissue segmentation, and cell segmentation. SAW automates this workflow via the CellBin pipeline (details in [2]). In the following sections, we'll examine the fundamental principles underlying each of these processing steps.

Figure 1. Stereo-seq image processing workflow. Image QC is performed in StereoMap Tools module, while the other steps are automated in standard analysis by SAW and can be manually adjusted in StereoMap.
Image QC is the critical first step to assess the trackline clarity and determine images are suitable for automatic registration in SAW. The Stereo-seq chip contains a DNA nanoball (DNB) array with capture probes anchored to each DNB, featuring engineered 1.5 µm probe-free zones in periodic horizontal and vertical patterns. These gaps appear as distinct black or white lines during microscopy imaging. Correspondingly, in the spatial gene expression heatmap, no data on these probe-free zones, resulting in black lines (Figure 2). These physical tracklines serve as intrinsic fiducial markers, enabling precise spatial alignment between high-resolution microscopic images and Stereo-seq data.
The StereoMap Tools module provides an Image QC utility to verify trackline visibility. A passing QC confirms the tracklines are sufficiently clear for automated processing. Achieving both high-quality tissue detail and sharp tracklines is challenging and requires: 1) multi-focus imaging: separate focal planes for tissue and tracklines; 2) optimized lighting/exposure: balanced to avoid overexposure (which loses tissue/cell detail) or underexposure (which obscures tracklines). For detailed imaging protocols, consult the Microscope Assessment Guideline [3]. Currently, poor trackline visibility remains one of the most frequent imaging issues. When this occurs, users should switch to manual registration method to continue the analysis.

Figure 2. Tracklines on the Stereo-seq Chip. Tracklines appear as thin black/white lines on microscopy images and gene expression heatmap, and serve as the reference markers for image registration.
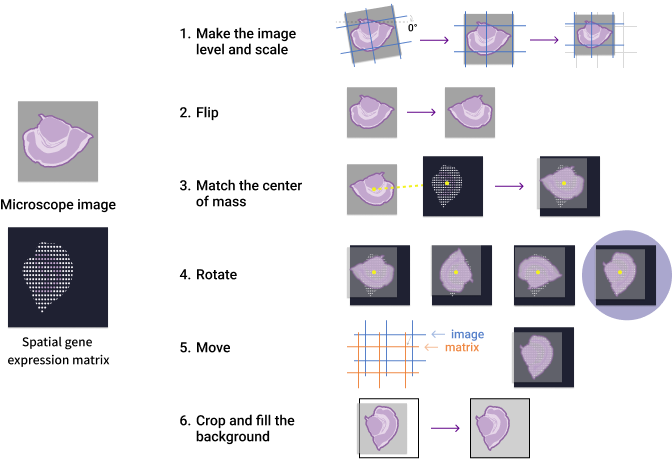
The image registration process spatially aligns microscopy images with gene expression heatmaps by utilizing both tissue morphology and the Stereo-seq chip's tracklines as reference points. As illustrated in Figure 3, SAW's automatic registration begins by detecting clear tracklines for initial adjustments, followed by an essential image flipping step. The algorithm then calculates the center of mass for both images and iteratively rotates them to determine the angle of maximal overlap. This optimal alignment is further refined through small adjustments using trackline references, followed by final cropping/padding to produce the registered image.

Figure 3. Automatic image registration process in SAW.
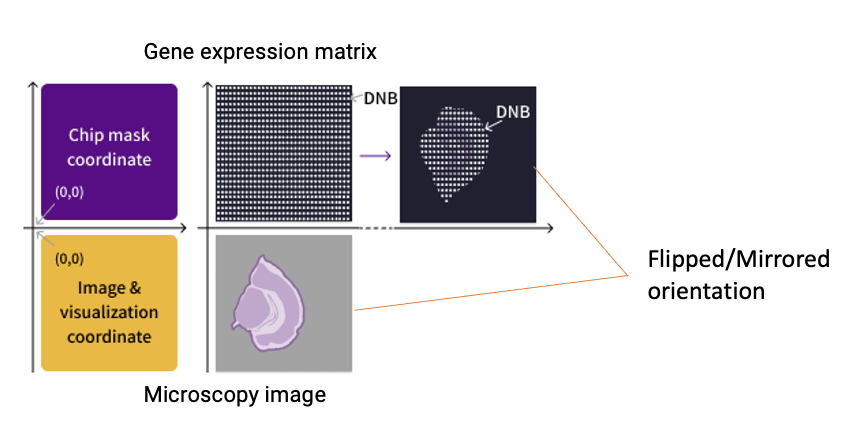
Notably, the flipping operation (Step 2) corrects for the inherent coordinate system discrepancy between the gene expression data (which uses the chip mask's bottom-left origin for spatial barcode decoding) and microscopy images (which typically follow the top-left origin convention, see Figure 4). Due to this processing step, the final registered image in the "SAW count" output will appear mirrored compared to the original microscopy image (which is perfectly normal!).

Figure 4. Coordinate system mismatch between the microscopy image and the gene expression heatmap. The automated registration includes a flipping step to reconcile orientation differences between these data types.
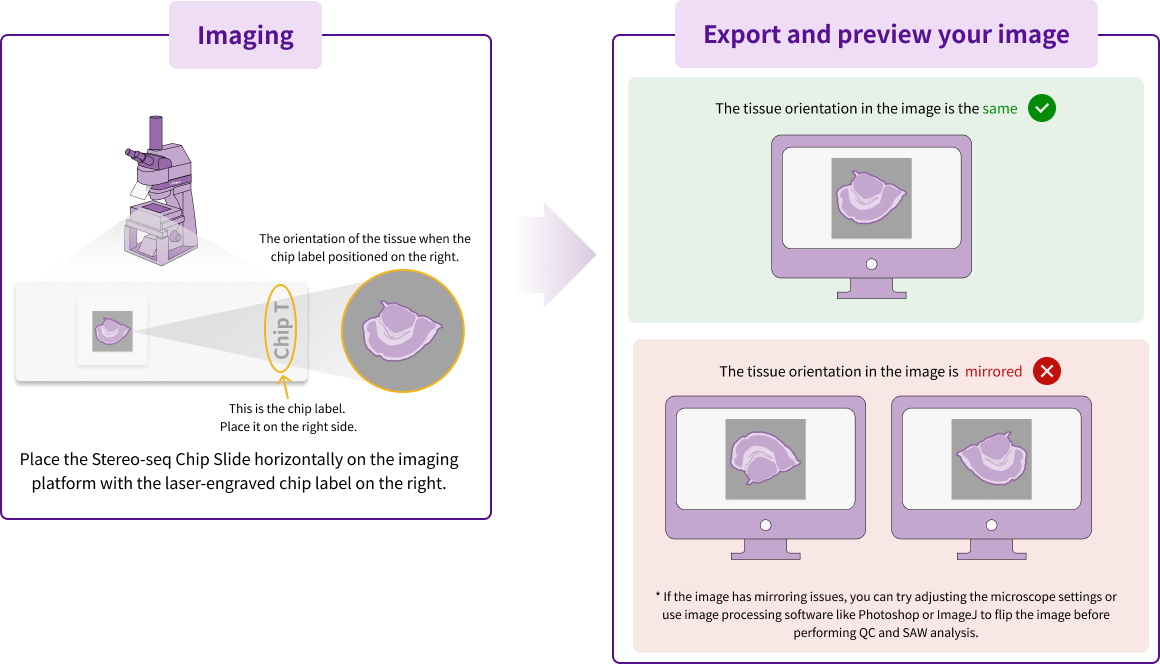
For successful automatic registration, two prerequisites must be met: 1) qualified tracklines in the microscopy image, achieved through Image QC pass as previously discussed, and 2) proper orientation of the input image. Figure 5 illustrates the standard configuration, where the correctly oriented images should preserve the same tissue orientation with the chip label positioned to the right (or facing the viewer if chip label could not be on right for certain microscope). However, variations in microscope optical configurations can sometimes produce inverted images that will fail the automatic registration. For such case, the recommend solution is to flip the image to be the correct orientation, and then proceed with the normal analysis steps.
Some users may only notice the orientation mismatch after completing SAW analysis, evidenced by misaligned registration between the registered image and gene expression heatmap in the output report. If this results from incorrect initial image orientation, you should manually flip the original image using image software, and then use this corrected oriented image for Image QC and the following analysis.

Figure 5. The correct image orientation required for automatic image registration.
When the automatic registration run into issues, users can employ manual registration through StereoMap’s Image Processing module. The underlying principle of manual registration is similar to the automatic one, but relies on manual work and visual check on the image alignment rather than the calculations and comparisons in silicon. The StereoMap provides various functions in the interactive interface, including scale, flip, rotation and move. Users adjust the microscopy image to align with the gene expression heatmap based on tissue morphology. This method can be applied regardless of chip version or imaging conditions, but can be laborious and somewhat subjective. Recently, there is a new manual registration option, and makes the registration as easy as one-click. But this only supports with new chip designs and requires the Image QC pass and imaging strictly following protocol. For more details on morphology-based and the feature point registrations, please refer to the StereoMap User Manual [5].
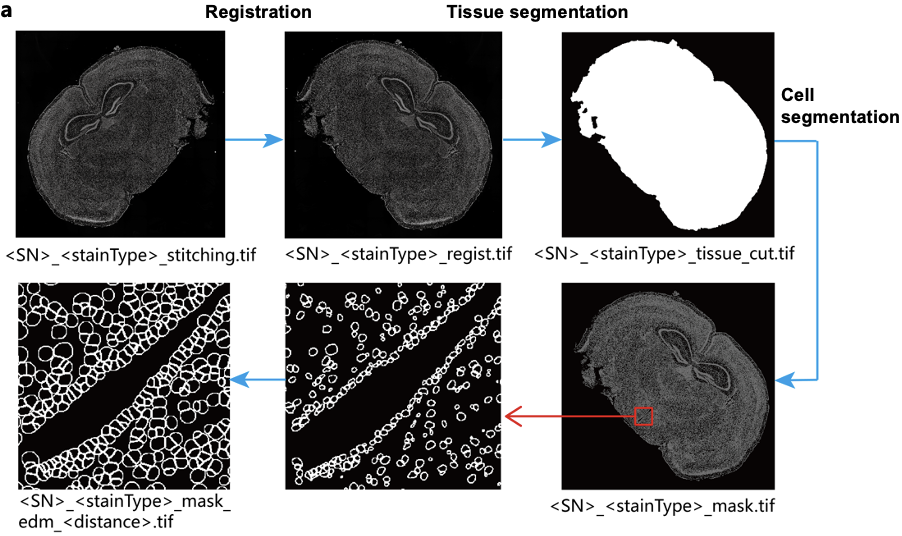
Tissue segmentation identifies the tissue-covered regions on the Stereo-seq chip using semantic segmentation on the microscopy image, generating a tissue mask (see example in Figure 6). By excluding non-tissue areas, this step reduces noise, resulting in cleaner data. For instance, when background artifacts (such as bright spots) or detached tissue fragments are present in the image, tissue segmentation can remove them. The quality of the automatic tissue segmentation depends on the imaging condition and tissue structures. Imperfect imaging (e.g., uneven lighting, blurry tissue boundaries) and complex tissue architectures can lead to suboptimal masks. In such cases, the manual correction on the tissue mask will be necessary.
Cell segmentation identifies cellular regions and generates a cell mask, building upon the tissue mask (Figure 6). The resulting cell mask is integrated with the spatial gene expression matrix to enable single-cell resolution analysis, which is essential for studies such as tumor microenvironment characterization, brain research, and immunology. In the SAW pipeline, nuclei-stained images (e.g., ssDNA or DAPI) are processed to detect nuclei boundaries. These boundaries are then expanded by a defined distance to approximate the cell boundary, forming the cellbin unit. This unit serves as the basis for cell-level gene expression extraction.
SAW built-in cell segmentation replies on a U-Net algorithm to identify nuclei boundaries, with accuracy influenced by cellular morphology (e.g., cell density and shape variability), image quality (particularly boundary sharpness), and scopes of the training data. This built-in model has been benchmarked on diverse tissue types including mouse organs (brain, kidney, lung, heart, etc.), human tissues (embryo, blood vessel, lymph node, pancreas cancer, liver cancer, etc.), and non-mouse/human samples (e.g., rat brain, zebrafish heart, Macaca brain, and pig uterus). For tissues and cell morphologies compatible with the SAW built-in model, the cell segmentation results are typically satisfactory. However, for tissues with unusual or unfamiliar morphologies that yield unsatisfactory results, trying other cell segmentation methods is recommended.

Figure 6. Image processing stages and outputs illustrated with mouse brain tissue. From blog [4].
1. The successful completion of SAW's automatic image processing depends on all four major steps, with StereoMap available for manual corrections.
2. Image QC validates trackline visibility, requiring optimal quality during imaging.
3. SAW's automatic registration includes an image-flipping step, producing registered images that are mirrored relative to the originals.
4. Correct predefined image orientation must be verified during imaging for proper registration.
5. SAW's built-in cell segmentation employs a deep-learning algorithm, with accuracy depends on cellular morphology, image quality, and training data quality.
By mastering these fundamentals, researchers can optimize their image processing and ensure efficient Stereo-seq data analysis. In our next blog, "Stereo-seq Image Processing: Troubleshooting Common Analysis Challenges", we will address frequent issues encountered during image analysis and provide practical solutions.
1. Stereo-seq Webinar | How to Process Image Data to Achieve Single-cell Resolution Gene Expression on Stereo-seq: https://en.stomics.tech/resources/videos/1115.html
2. CellBin: The Core Image Processing Pipeline in SAW for Generating Single-cell Gene Expression Data for Stereo-seq. https://en.stomics.tech/news/stomics-blog/1017.html
3. Microscope Assessment Guideline: https://enfile.stomics.tech/STUM-PE001%20Microscope%20Assessment%20Guideline_ver%20C.pdf
4. A Practical Guide to SAW Output Files for Stereo-seq: https://en.stomics.tech/news/stomics-blog/1108.html
5. StereoMap User Manual: https://en.stomics.tech/service/stereoMap-operation-manual.html