
In the rapidly evolving landscape of spatial biology, researchers have long faced a difficult trade-off. Traditional spatial transcriptomics provides a high-level blueprint of gene activity, but it often misses the functional execution performed by proteins. Conversely, spatial proteomics offers a look at the "workers" of the cell but typically limits the view to a handful of targets.
STOmics' Stereo-CITE Proteo-Transcriptomics Solution is fundamentally reshaping spatial biology by bridging the gap between traditional imaging and high-throughput sequencing. While imaging-based proteomics excels in morphological clarity and protein abundance detection, it often faces bottlenecks in simultaneous whole-transcriptome profiling and scaling plexity due to fluorescence channel limits or tissue damage from stripping.
Stereo-CITE overcomes these by leveraging an omics-based logic: it achieves the concurrent detection of 100+ protein markers and the whole transcriptome on a single section at single-cell resolution. This capability eliminates spatial biasinherent in aligning disparate slices, allowing scientists to examine a cell's transcriptomic plan and its proteomic performance simultaneously. By transforming protein distribution into digital, sequenceable information, Stereo-CITE bypasses issues like auto-fluorescence and antigen degradation, offering a high-throughput, unbiased edge that defines a new technical paradigm for high-dimensional spatial multi-omics.
The Power of Simultaneous Profiling
The complexity of biological systems, particularly in immunology and oncology, requires more than just one layer of data. Why does pairing RNA with protein markers matter? While mRNA levels indicate the potential for cellular function, protein expression is the ultimate realization of that function. In the tumor microenvironment (TME), for instance, the presence of specific immune checkpoints or signaling proteins can be the deciding factor in therapeutic response, regardless of what the transcriptomic data suggests.
Stereo-CITE is intended to simultaneously detect the whole transcriptome and high-plex protein on the same tissue section. Built upon DNA Nanoball (DNB) technology, it offers a "tissue-to-data" solution that captures these dual layers at nanoscale resolution across a centimeter-sized field of view (FOV).
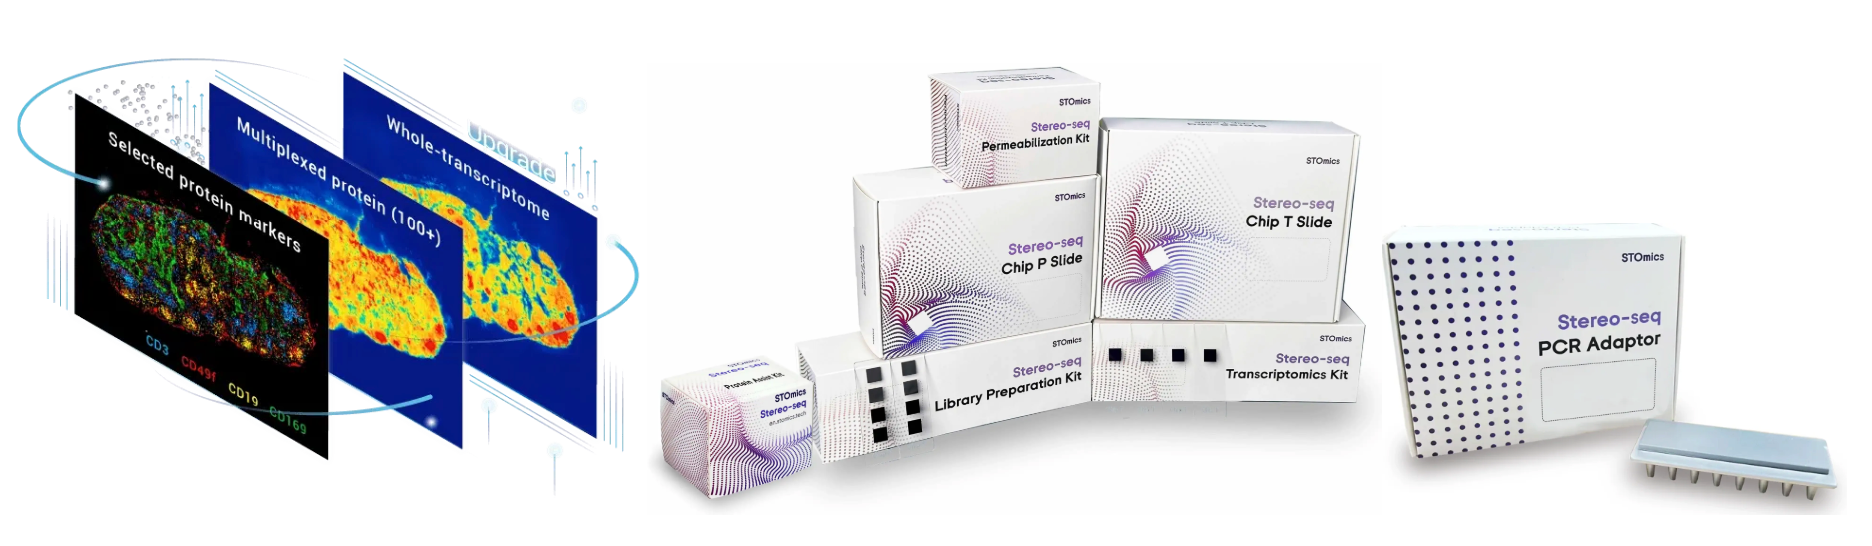
Figure 1. Stereo-CITE Proteo-Transcriptomics Solution (https://en.stomics.tech/products/Stereo-CITE-Solution)
How Stereo-CITE Works: A Five-Step Workflow
Stereo-CITE is STOmics' integrated spatial multi-omics platform that combines the strengths of Stereo-seq and Cellular Indexing of Transcriptomes and Epitopes by Sequencing (CITE-seq). Built on DNB technology and a poly-T-based Stereo-seq Chip T, the system captures both mRNA molecules and antibody-derived tags (ADTs) directly in situ. The workflow is streamlined into five integrated stages:
Sample Preparation: Fresh frozen tissue sections are mounted onto the Stereo-seq Chip T, which contains spatially barcoded capture probes. This ensures that all downstream molecular signals retain precise spatial coordinates.
Blocking & Antibody Incubation: After blocking, the tissue is incubated with antibodies carrying Antibody-Derived Tags (ADTs). By capping a protein-specific DNA barcode with a poly-A tail, the ADT allows protein signals to "mimic" mRNA. This allows the chip to capture 100+ proteins simultaneously alongside the transcriptome—no hardware changes or extra rounds of imaging required.
Imaging: High-resolution imaging is performed after staining, providing morphological context that can later be integrated with molecular data.
mRNA and ADT Capture & cDNA Synthesis: After permeabilization, both mRNA molecules and ADTs are captured in situ by the chip. Reverse transcription then converts captured molecules into cDNA, preserving spatial information.
Library Construction, Sequencing & Data Analysis: Separate transcriptome and protein libraries are constructed, then sequenced on DNBSEQ-T7RS or DNBSEQ-G400RS platforms. Raw reads are processed through the SAW (Stereo-seq Analysis Workflow) pipeline and visualized interactively in StereoMap to deliver spatially resolved expression maps for both transcriptome and protein panel.

Figure 2. Stereo-CITE Proteo-Transcriptomics Set V1.1 Workflow
What Does This Mean for Researchers?
Three capabilities define what Stereo-CITE makes possible in practice:
Profile the whole immune landscape, simultaneously. With 100+ protein targets detectable in a single run—including the freedom to design the own antibody panel from validated vendors—researchers no longer face the painful trade-off of which markers to drop. Characterize cell-type identity, activation state, checkpoint expression, and structural proteins all at once, in the same tissue section.
Resolution you can trust at the single-cell level. Stereo-CITE delivers true single-cell resolution for both transcriptomeand protein readouts. Unlike approaches that pool signal across multicellular spots, data here maps to the subcellular-to-single-cell scale—critical when your biological question depends on resolving rare populations, transitional states, or microenvironmental gradients within a tumor or lymphoid organ.
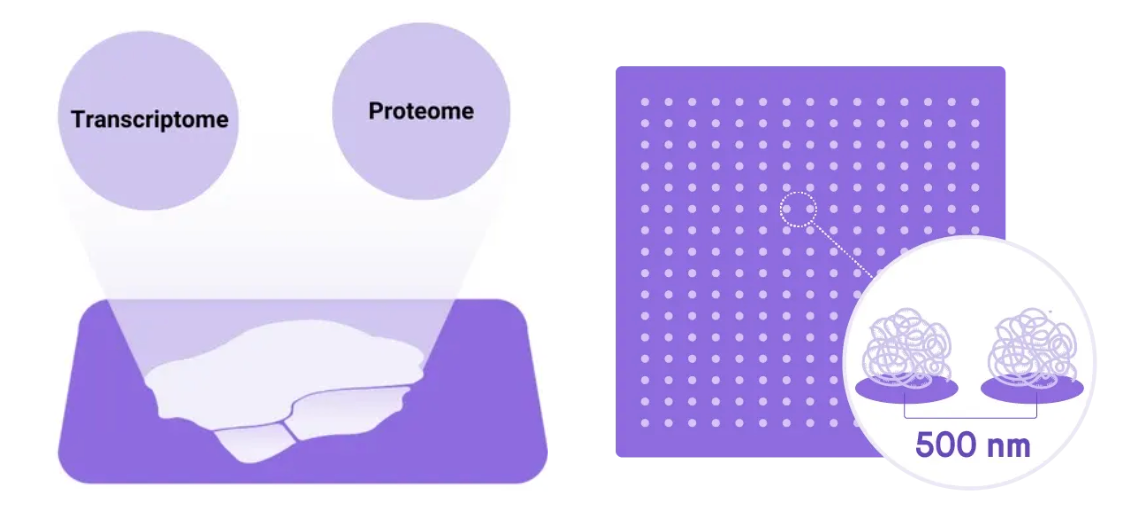
Figure 3. True Single-cell Resolution for Both Transcriptome and Protein analysis.
Validated across human and mouse tissues, without autofluorescence. Validated tissue types span human lung cancer, tonsil, lymph node, cervical cancer, lymphoma as well as mouse spleen, liver, and esophageal cancer models. Because protein detection relies on sequencing-based ADT readout rather than fluorescence, there is no autofluorescence interference and no antigen instability from multiple staining rounds. Consistency analysis across three adjacent tissue sections has demonstrated strong reproducibility in both transcriptome and protein distributions.
Seeing It in Action: Mouse Spleen Demo Data
The mouse spleen is a structurally defined organ with distinct compartments—red pulp, white pulp, and marginal zone—each populated by characteristic immune cell populations that differ sharply in both marker expression and transcriptional state. It is, in many ways, an ideal benchmark tissue for spatial multi-omics: complex enough to be biologically meaningful, yet architecturally predictable enough to validate resolution and sensitivity.
The demo dataset was generated from a 10 μm fresh-frozen spleen section from a 6–8 week male C57BL/6 mouse (RIN 6.5), processed with Stereo-CITE T FF V1.1 on a 1 cm × 1 cm Chip T slide. Sequencing on the DNBSEQ-T7RS platform produced 2.73 billion RNA reads and 1.55 billion protein reads.
Processed through SAW V8.1 and visualized in StereoMap V4.1, the results speak for themselves. At the Bin200 tissue scale, each capture unit yields a median of 92,454 RNA MIDs and 332,155 protein MIDs across 11,526 gene types. At single-cell Bin20 resolution, individual units resolve 942 RNA MIDs, 3,299 protein MIDs, and 646 gene types with 128 proteins profiled simultaneously across the entire section. The clustering map resolves B cell zones, T cell areas, and marginal zone populations with spatial precision, RNA and protein channels in full concordance.
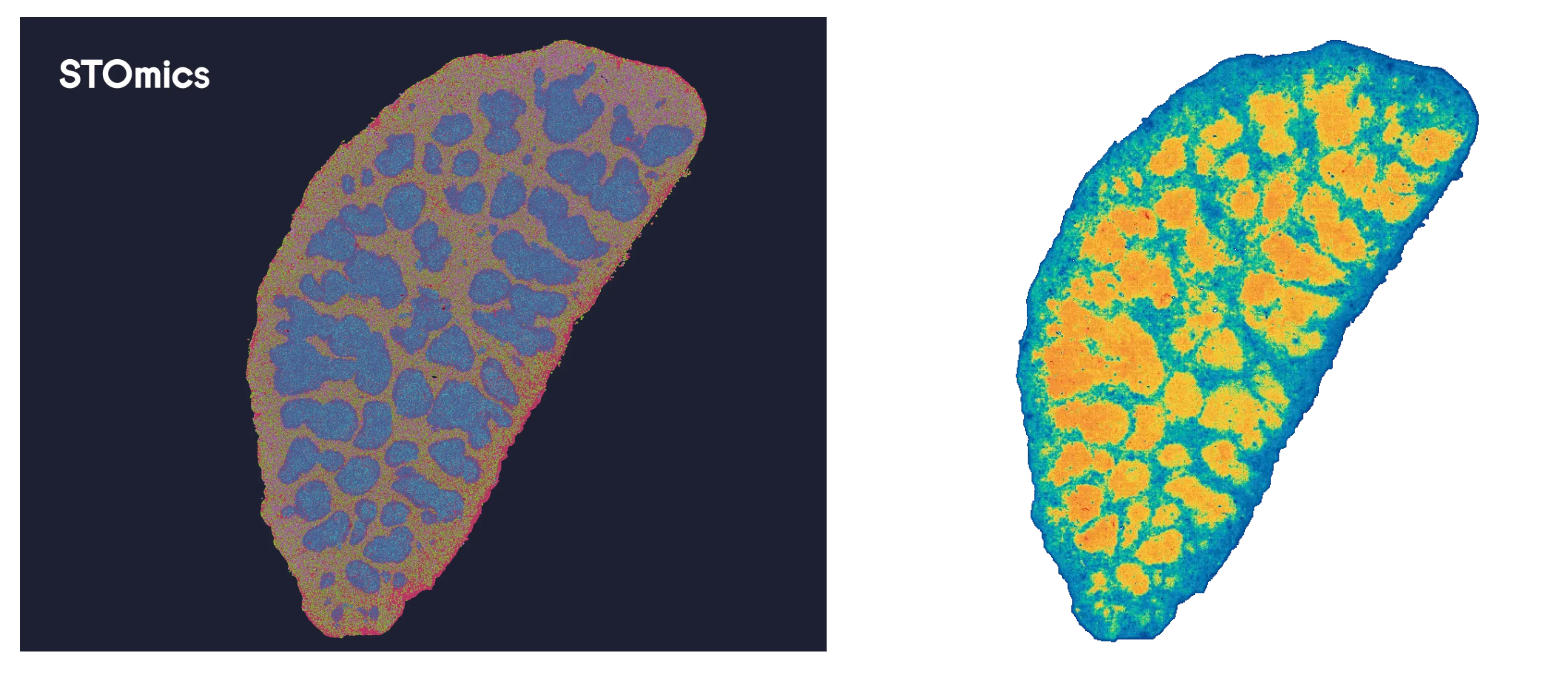
Figure 4. Spatial Gene Expression Distribution in Mouse Spleen Demo Data
Ready to See the Full Picture?
Whether you are mapping the tumor microenvironment, constructing a cell-type atlas, or interrogating immune cell states in autoimmune or infectious disease models, Stereo-CITE delivers the molecular completeness that single-modality platforms cannot, without sacrificing resolution, multiplexing depth, or spatial fidelity.
Everything you need to run Stereo-CITE in your own laboratory is available as a complete kit solution. The full workflow from permeabilization optimization through library preparation is supported by the following reagent sets:
Table 1. Stereo-seq Kit Solution List for Stereo-CITE
→ Explore Stereo-CITE Proteo-Transcriptomics Solution: en.stomics.tech/products/Stereo-CITE-Solution/list.html
→ Download the User Guidance PDF: Stereo-CITE Proteo-Transcriptomics Set V1.1 User Guidance
To learn more about how our spatiotemporal omics solutions can support your research, please feel free to Contact Us or reach out via email at info_global@stomics.tech.
FAQs
Q: Can researchers use a custom antibody panel, or is a pre-defined set required?
A: Stereo-CITE supports fully custom panels of 100+ protein targets. Antibodies from in-house validated vendors are conjugated to ADT oligonucleotides following standard CITE-seq chemistry, giving researchers complete flexibility to tailor the panel to their specific tissue type, biological question, and target list.
Q: How is the optimal permeabilization time determined?
A: The Stereo-seq Permeabilization Set for Chip-on-a-slide V1.1 (Cat. 211SP11118) is designed specifically for this optimization step, enabling empirical determination of the ideal permeabilization conditions for each tissue type before committing to a full run. Detailed guidance is provided in the accompanying User Manual (STUM-PR004).
Q: What bioinformatics tools are required for Stereo-CITE data analysis?
A: Two STOmics tools support the full pipeline. SAW handles spatial mapping, feature quantification, and expression matrix generation for both RNA and protein channels. StereoMap provides interactive clustering, visualization, and spatial overlay without requiring advanced coding expertise. Both are freely accessible via the STOmics resources portal.